Figures & data
Table I. Patient specific data.
Figure 1. Volume of Interest (VOI). Transversal (top), coronal (middle) and sagital (bottom) slice showing the VOI for a patient with advanced cervical cancer. Overlaid is the diffusion map calculated using a monoexponential model to the b-values in the range 150–1 000 s/mm2. The color scale has the units × 10−3 mm2/s.
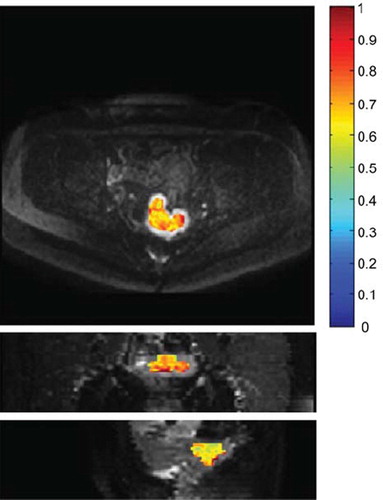
Table II. Comparison of different combinations of diffusion gradients (b-values).
Figure 2. Curvature of the biexponential fits to the diffusion data. The maximum curvature indicates the limit where the contributions from perfusion and diffusion changes dominance. This was consequently found to be at b = 43 ± 15 s/mm2.
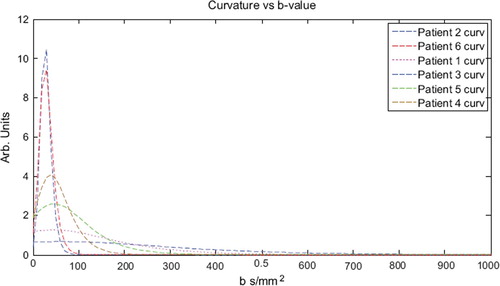
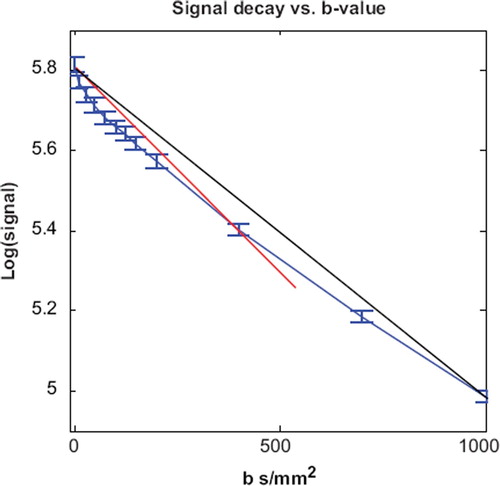
Figure 3. Variation of the apparent diffusion coefficient. The blue line is the signal decay from patient 1. The red line corresponds to an ADC of 0.99 mm2/s obtained by monoexponential fit using b-values 0 and 400 s/mm2. The black line corresponds to an ADC 0.79 mm2/s (b-values 0 and 1000 s/mm2). The diffusion coefficients are overestimated by 48% and 18%, respectively.