Figures & data
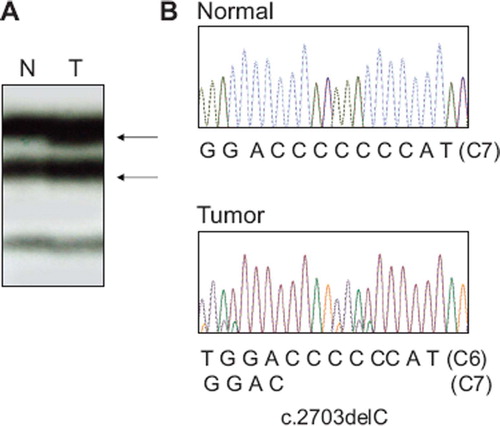
Figure 1. Mutation of HDAC4 exon 22 in a gastric carcinoma with MSI-H. A. PCR product of HDAC4 exon 22 from a gastric carcinoma shows aberrant bands (arrows in lane T) as compared to SSCP from normal tissue (N) of the same patient. B. Direct DNA sequencing analysis shows a heterozygous C deletion within the C7 in tumor tissue as compare to normal tissue.