Figures & data
Table I. Patient characteristics.
Table II. Pneumonitis grading scale.
Table III. Pneumonitis grade.
Table IV. Clinical and treatment parameters in patients with and without RP events (Grade 2 or greater); p-values are computed by the unpaired t-test (continuous variables) or the chi-square test (categorical variables).
Figure 1. Coronal view of a treatment plan with a significant high dose overlap with the heart (yellow contour line: whole lung; green contour line: PTV; blue contour line: heart).
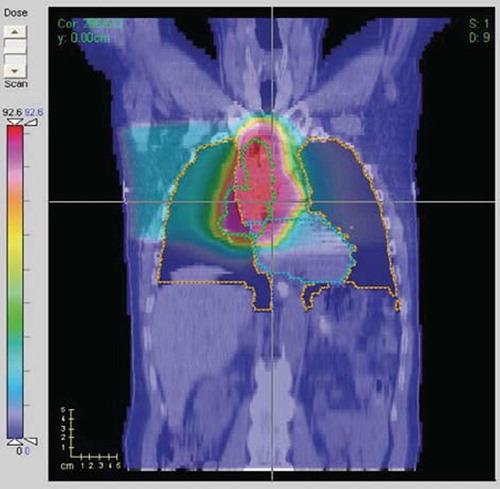
Figure 2. (a) Univariate Spearman's rank correlation of RP events with Dx's of the normal lungs or heart volumes; (b) Univariate Spearman's rank correlation of RP events with Vx's of the normal lung or heart volumes; (c) Univariate Spearman's rank correlation of RP events with ‘MOHx’ of normal lung or the heart. Dx is the minimum dose to the x% volume receiving the highest dose (the peak in the heart curve near a Dx of 5%); Vx is the percent volume receiving at least x dose (in Gy) (the peak in heart Vx near 65–70 Gy); MOHx is mean dose of the hottest x% of a structure.
Table V. Summary of dosimetric statistics of heart DVHs.
Table VI. Highest correlated variables with RP incidence based on univariate logistic regression.
Figure 3. The cross-correlations of intra-organ or inter-organs dosimetric parameters: (a) Dx_Lung vs. Vx_Lung; (b) Dx_Heart vs. Vx_Heart; (c) MOHx_H vs. MOHx_L. Note: NTCP: normal tissue complication probability.
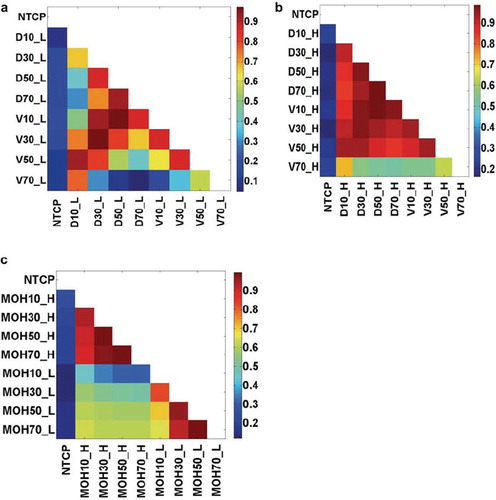
Figure 4. Multivariate model selection bootstrap frequency (MaxD_L: Maximum Lung Dose; ConChemo: Con-current chemotherapy). The variable selection process was done using bootstrap sampling technique. The frequency of model selection is shown for the five most frequently selected models.
Table VII. Model coefficient values and individual 95% confidence intervals (Wald intervals).
Figure 5. Mean predicted rates of RP vs. observed rates for patients binned by predicted risk. The patients are binned according to predicted risk of RP by the three-variable model (heart D10, lung D35, and maximum dose of the lung) with equal patient numbers in each bin. The mean predicted and observed event rates in each bin are (risk; events/pts.): (0.0581; 5/35), (0.1087; 1/35), (0.1671; 6/35), (0.2481; 7/35), (0.3494; 11/35), (0.4568; 18/35).
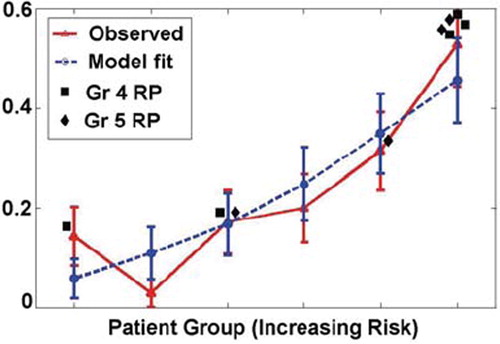
Figure 6. ROC curve based on the best three-variable logistic regression model: heart D10, lung D35, and maximum dose of the lung, with area under the curve (AUC) of 0.72.
Figure 7. Scattering plots: a. D35_L vs. and MaxD_L; b. D10_H vs. D35_L; c. D10_H vs. MLD.
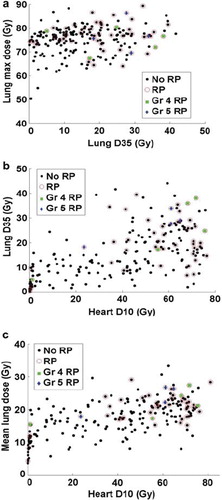
Table VIII. Model performance comparison on institutional dataset (all variables had positive coefficients).