Figures & data
Table I. Summary of differences between planning and follow-up scans.
Figure 1. Examples of radiological pneumonitis scored as mild, moderate, or severe.
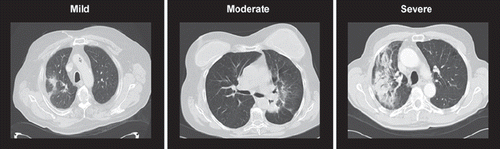
Figure 2. A. Representative example of using deformable registration to account for breathing. B. A unique situation illustrating the limits of deformable registration. The left-sided pleural effusion has resolved, but pneumonitis occurs in the same region. The deformed lung volume (outlined in white) does not include the region of pneumonitis.
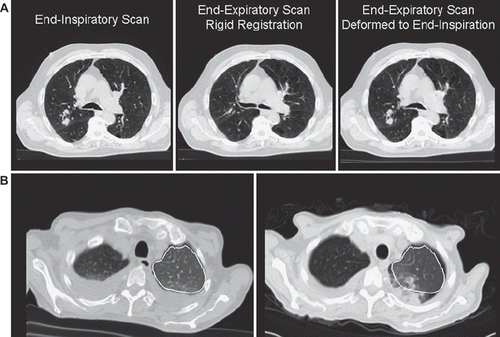
Figure 3. A. Changes in lung Hounsfield unit density with breathing for four patients. Mean values are plotted for each phase of the breathing cycle. Standard deviations range from 0.001 to 0.04 (not shown). B. Lung density values as measured on the end-expiratory phase of the 4D-CT scan, after it was deformed to match each of the other phases of breathing, indicating that the HU density values did not change appreciably when the scans were deformed.
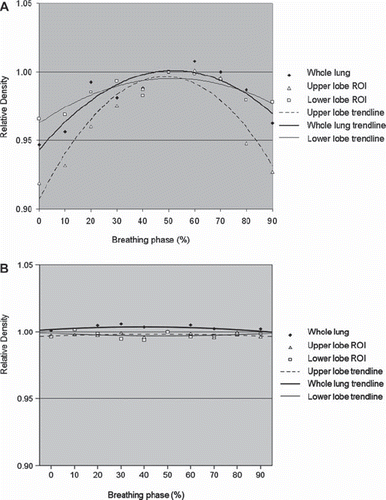
Table II. Accuracy of rigid registration vs. deformable registration.*
Figure 4. Changes in ipsilateral whole lung density (left) for all 18 patients (left) did not correlate with degree of pneumonitis (Spearman's r = 0.30; p = 0.22) whereas changes in lung density in the peri-tumoral region (right) showed strong correlation with radiological pneumonitis (Spearman's r = 0.75; p < 0.001). Mean values for each category are denoted by open circles, and error bars represent one standard error (SE). HU: Hounsfield units.
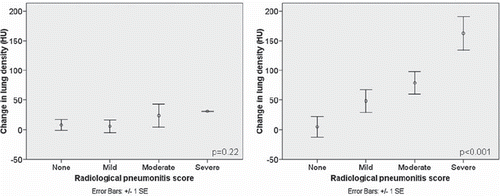
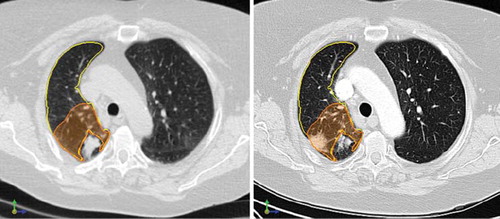
Figure 5. Pre- and post-treatment scans, showing radiological pneumonitis near the original tumor. Left: Deformed end-inspiratory phase of pre-treatment 4D-CT scan, with a right-sided tumor evident. The ipsilateral lung (yellow) and 3-cm expansion around the tumor (orange) are contoured. Right: Follow-up scan three months later, showing good resolution of the tumor, with a new area of radiological pneumonitis in the peri-tumoral region.