2,250
Views
27
CrossRef citations to date
0
Altmetric
Research Article

NTCP modelling of lung toxicity after SBRT comparing the universal survival curve and the linear quadratic model for fractionation correction

, , , , , , , , , , , , , , & show all
Pages 518-527 | Received 21 Jun 2010, Accepted 19 Nov 2010, Published online: 04 Jan 2011

Figures & data

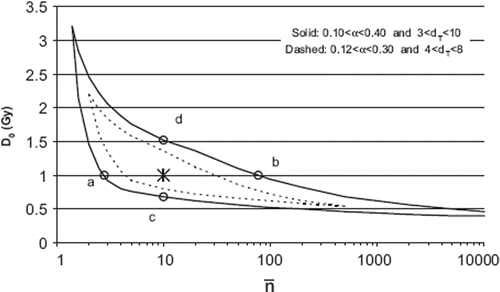
Figure 1. Parameter space of D0 and

for α and dT restricted to values given in the figure. The star (*) represent parameters (D0 = 1 Gy and
= 10) chosen for further modelling. The four points a-d represents different parameter sets of D0 and
used for a sensitivity test of α and dT.

Figure 1. Parameter space of D0 and Display full size for α and dT restricted to values given in the figure. The star (*) represent parameters (D0 = 1 Gy and Display full size = 10) chosen for further modelling. The four points a-d represents different parameter sets of D0 and Display full size used for a sensitivity test of α and dT.

Figure 2. Calculated survival curves for the LQ model with α/β = 3, and α equal to 0.206 (black line), and for the SHMT model (grey line). The grey dashed line (EXP) shows the extrapolation of the linear portion of the SHMT target curve. The smooth transition from the LQ- to the linear portion of the SHMT model is at the dose dT = 5.8 Gy (indicated by the circle). The dose of 2 Gy, to which all DVH data were converted, is marked in the figure.
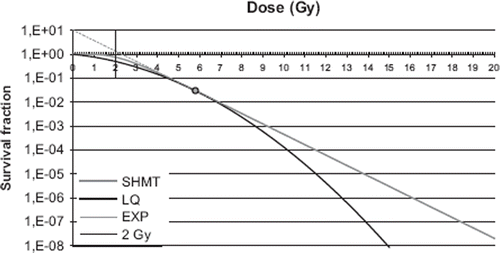
Figure 2. Calculated survival curves for the LQ model with α/β = 3, and α equal to 0.206 (black line), and for the SHMT model (grey line). The grey dashed line (EXP) shows the extrapolation of the linear portion of the SHMT target curve. The smooth transition from the LQ- to the linear portion of the SHMT model is at the dose dT = 5.8 Gy (indicated by the circle). The dose of 2 Gy, to which all DVH data were converted, is marked in the figure.

Figure 3. Dose-volume-histograms (DVHs) of the total lung volume minus GTV in cm3 for the 57 SBRT patients. Six patients with RP2+ are marked with black lines. An enlargement for better visualization is inserted.
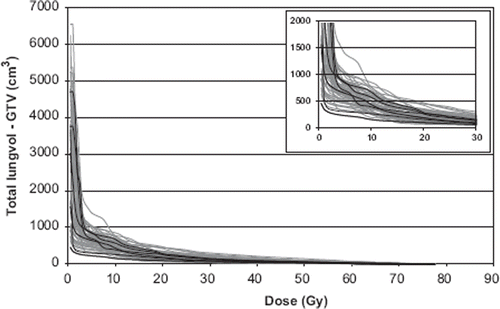
Figure 3. Dose-volume-histograms (DVHs) of the total lung volume minus GTV in cm3 for the 57 SBRT patients. Six patients with RP2+ are marked with black lines. An enlargement for better visualization is inserted.

Table I. Values of the parameter n from the NTCP modelling.

Table II. Summary of published SBRT data. Incidences of RP2+ and estimated EUD.

Figure 4. Incidence of RP2+ as a function of equivalent uniform dose (EUD) calculated with n = 0.71. The line shows NTCP calculated with parameters m = 0.30, D50 = 30 Gy. The value of the parameter n was determined from the data point EUD = 15 Gy and incidence of RP2+ = 10.5% (Baumann et al. 2008). As a sensitivity test of n, the incidences 5% (0.05) and 15% (0.15) at 15 Gy, were modelled (dotted line). References in .
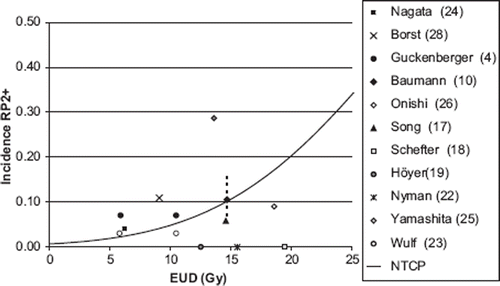
Figure 4. Incidence of RP2+ as a function of equivalent uniform dose (EUD) calculated with n = 0.71. The line shows NTCP calculated with parameters m = 0.30, D50 = 30 Gy. The value of the parameter n was determined from the data point EUD = 15 Gy and incidence of RP2+ = 10.5% (Baumann et al. 2008). As a sensitivity test of n, the incidences 5% (0.05) and 15% (0.15) at 15 Gy, were modelled (dotted line). References in Table II.

Figure 5. Fractional NTCPfract calculated with DVH-data corrected with USC and LQ (α/β = 3) as a function of cut-off dose for a representative patient. The plot illustrates the cumulative contribution to the NTCP. With the USC correction the low doses have less impact on NTCP compared to what is seen with the LQ correction.
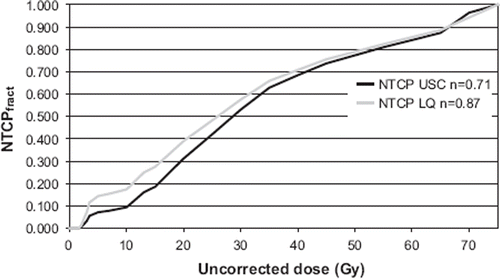
Figure 5. Fractional NTCPfract calculated with DVH-data corrected with USC and LQ (α/β = 3) as a function of cut-off dose for a representative patient. The plot illustrates the cumulative contribution to the NTCP. With the USC correction the low doses have less impact on NTCP compared to what is seen with the LQ correction.

Figure 6. The total uncorrected dose given in three fractions as a function of the dose given in 2 Gy per fraction (EQD2) using different fractionation correction models (LQ, uncorrected and USC). The dose level of 15 Gy × 3, used in the clinical data set is marked in the figure. Note, this refers to lung and not to tumour tissue.
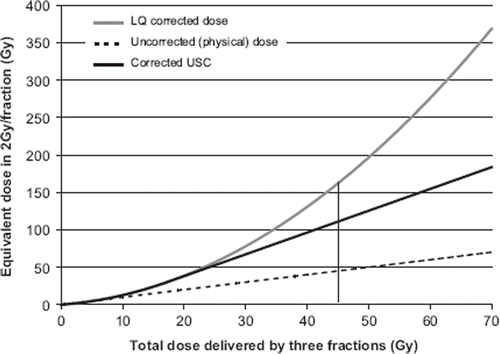
Figure 6. The total uncorrected dose given in three fractions as a function of the dose given in 2 Gy per fraction (EQD2) using different fractionation correction models (LQ, uncorrected and USC). The dose level of 15 Gy × 3, used in the clinical data set is marked in the figure. Note, this refers to lung and not to tumour tissue.
Supplemental material

Review of lung toxicity data versus mean lung dose.

Download PDF (131.5 KB)

Reprints and Corporate Permissions

Please note: Selecting permissions does not provide access to the full text of the article, please see our help page How do I view content?

To request a reprint or corporate permissions for this article, please click on the relevant link below:

Academic Permissions

Please note: Selecting permissions does not provide access to the full text of the article, please see our help page How do I view content?

Obtain permissions instantly via Rightslink by clicking on the button below:

If you are unable to obtain permissions via Rightslink, please complete and submit this Permissions form. For more information, please visit our Permissions help page.