Figures & data
Table I. Characteristics of the four trails comparing gefitinib with docetaxel in previously treated advanced NSCLC.
Figure 1. Meta-analysis for overall survival showed no significant difference between gefitinib and docetaxe in previously treated advanced NSCLC (HR = 1.02, 95% CI = 0.92–1.12, p = 0.70).
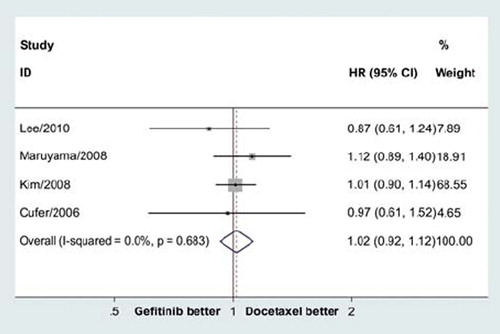
Figure 2. Meta-analysis for progression-free survival showed no significant difference between gefitinib and docetaxe in previously treated advanced NSCLC (HR = 0.97, 95% CI = 0.88–1.07, p = 0.57).
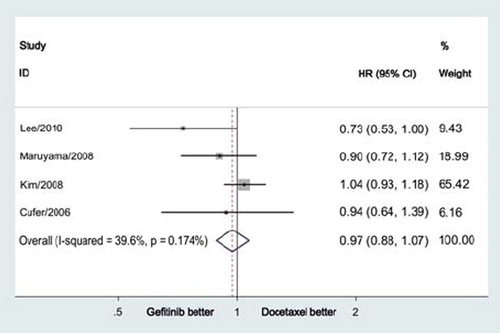
Figure 3. Meta-analysis showed that gefitinib significantly improved overall response rate compared with docetaxe in previously treated advanced NSCLC (RR = 1.58, 95% CI = 1.02–2.45, p = 0.04).
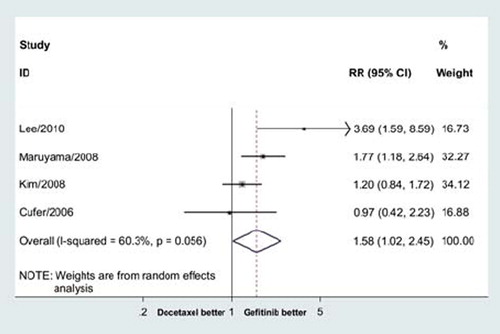
Table II. Results of the meta-analysis for QOL, symptom improvement and main grade 3 or 4 toxicities.