Figures & data
Table I. Main characteristics of patients cohort.
Figure 1. Examples of dose distributions for the four groups of patients. Colourwash scale is reported on the figure. Solid lines represents target volumes and organs at risk.
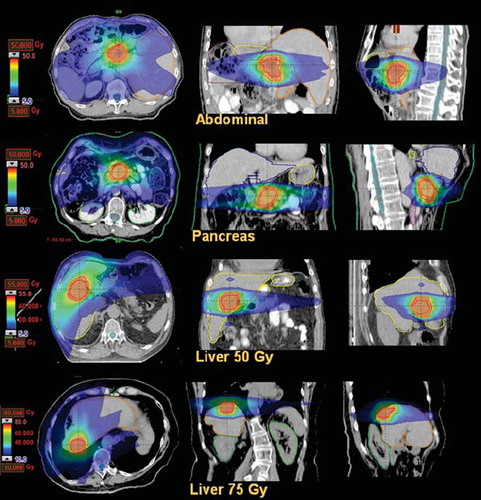
Figure 2. Average dose volume histograms for target volumes and healthy tissue for the abdominal metastases patients. Dashed lines represent the inter-patient variability at one standard deviation.
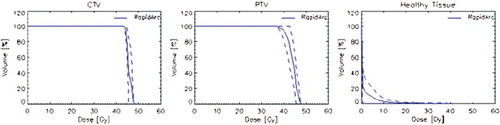
Figure 3. Average dose volume histograms for target volumes and healthy tissue for the pancreas patients.
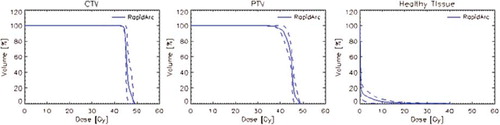
Figure 4. Average dose volume histograms for target volumes and liver for the hepatic patients treated at 45 Gy.
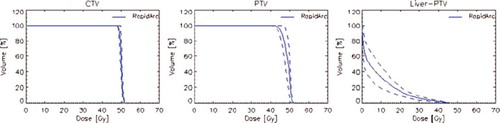
Figure 5. Average dose volume histograms for target volumes and liver for the hepatic patients treated at 75 Gy.
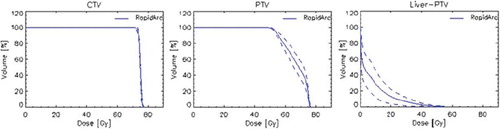
Table II. Main technical features of delivered treatments.
Table III. Summary of dose volume histogram analysis for CTV, PTV and healthy tissue.
Table IV. Summary of dose volume histogram analysis for organs at risk.