Figures & data
Table I. Patients characteristics.
Figure 1. CT and CBCT overlay in coronal and transverse and sagital plane. The area defined in yellow represents C-PTV (a), C-carina (b), C-vertebrae (c) and C-thorax (d) clipbox definition.
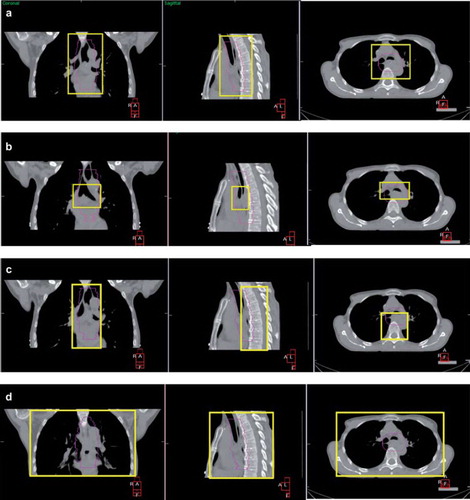
Table II. Summary of whole population average systematic and random translational errors.
Table III. Summary of whole population average systematic and random rotational errors.
Figure 2. Percentage of registrations within 2 mm when C-carina, C-vertebrae and C-thorax compared to C-PTV clipbox.
Figure 3. Percentage of rotations within 2 degrees when C-carina and C-thorax compared to C-PTV clipbox.