Figures & data
Table I. Maximum and minimum displacements in the lung phantom study: For no translation between scan copies and for offline introduced translations of 1 cm in lateral, longitudinal and vertical directions, respectively. Displacement distances in phantom and in air are estimated using the tools available in the TPS and global maximum displacement values are extracted directly from the data using MATLAB. In air all minimum displacements were 0 mm and hence are not tabulated.
Table II. Maximum displacements in the water equivalent phantom study: The base phantom CT image acting as source (base→enlarged) corresponds to an expansion, whereas the base phantom image acting as target (enlarged→base) corresponds to a contraction. Displacement distances in phantom and in air are estimated using the tools available in the TPS and global maximum displacement values are extracted directly from the data using MATLAB. Minimum displacements were 0 mm in all cases and hence are not tabulated.
Figure 1. Illustration of the process of validating the MATLAB program's interpretation of image metrics, comparing DIRs between CT scans of phantom blocks of water equivalent material extending a base block of 20 cm × 20 cm × 20 cm in lateral, longitudinal and vertical directions by 2 cm. Here the deformation vector lengths are displayed in colour contour-plots overlying the corresponding CT images in transversal, frontal and sagittal image planes as required to verify axis orientation. In figures showing the transversal imaging plane the horizontal axis shows lateral pixel value and the vertical axis shows vertical pixel value (note that the TPS rescales the 512 × 512 pixels CT images to 256 × 256 pixels when performing the DIR). In figures showing the frontal or sagittal imaging planes the horizontal axis shows lateral and vertical pixel values respectively, whereas the vertical axis shows CT slice number, corresponding to the longitudinal direction. Displacement vector directions are shown as an insert under all figures, verifying correct MATLAB representation of DVFs (shown here for expansion, i.e. base→enlarged phantom image).
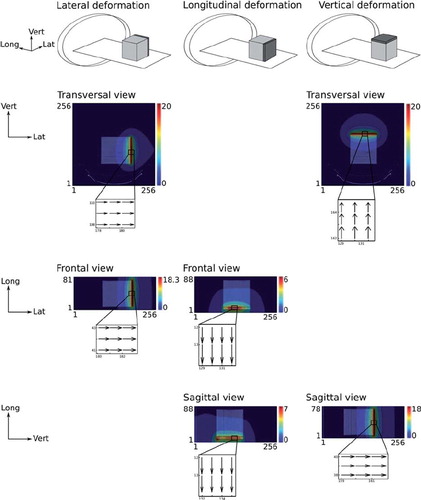
Figure 2. Comparison of PE→PI vs. PI→PE registrations in the 4D-CT image for Patient 1 with abdominal compression in the same CT slice. First row shows the vector size colour coded contour map for the DVF of the PE-PI registration (expanding direction), the PI-PE registration (contracting direction) and a difference maps showing the discrepancies between predicted lengths, all in millimetres. Second row shows the corresponding Jacobian maps and a difference map between these, calculated as the absolute value of Jacobians of the expanding direction DVF minus one, minus the absolute value of Jacobians of the contracting direction DVF minus one. (Note that the TPS rescales the 512 × 512 pixels CT images to 256 × 256 pixels when performing the DIR.)
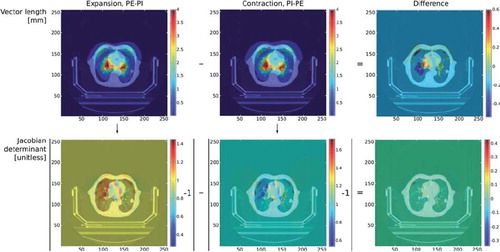
Table III. Maximum difference in vector lengths in the patient scans: PE→PI DIR vector lengths are compared to PI→PE DIR vector lengths using MATLAB. With/without refers to the patient scan with or without use of abdominal compression.
Figure 3. Vectors in the DVFs resulting from DIRs between PI and PE phases and the stepwise expansion and contraction corresponding to the PE→PI registration and the PI→PE registration respectively in a thoracic 4D-CT scan of a patient in SBF fixation without abdominal compression. Numbers indicate the phase of the breathing cycle as percent completed. The first number indicates the source image and the second number indicates the target image. The selected section of the DVF corresponds to a zoomed-in area around the particular patient's tumour in the transversal plane at a fixed longitudinal position. Horizontal axis shows lateral pixel value, vertical axis shows vertical pixel value. Note that the 512 × 512 pixels CT images are scaled to 256 × 256 pixels by the TPS when performing the DIR. The vector sizes and directions of the smaller-step deformations verify that stepwise expansion corresponds to the predicted total expansion of the PE→PI registration and similarly for the contraction of the PI→PE registration.
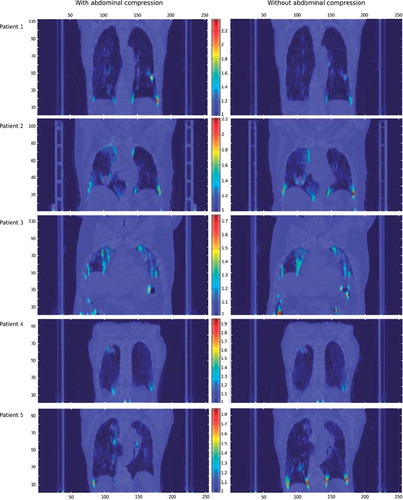
Figure 4. Ventilation maps for all patients both with and without abdominal compression in a frontal imaging plane showing the patients’ tumours. Horizontal axis shows lateral pixel value (the TPS converts the 512 × 512 pixels CT images to 256 × 256 pixels when performing a DIR), vertical axis shows CT slice number. Note that the colour scales, showing the value of the Jacobian determinant (Det(J), unitless), are synchronised for each patient, while it changes the upper limit between patients. The lower limit is set at Det(J) = 1 corresponding to no local volume change. The brightest areas of the ventilation maps thus have the highest ventilation.