Figures & data
Table I. Patient and tumor characteristics for the three dogs in the study.
Figure 1. Precontrast coronal CT images of patient A–C with PET activity and CT contrast enhancement obtained one minute post injection given as overlay. Level/window settings (see color bars) are indicated. The red circle indicates the location of the tumor. Images were obtained at two sessions; one prior to and one after the course of fractionated radiotherapy (session 1 and 2, respectively).
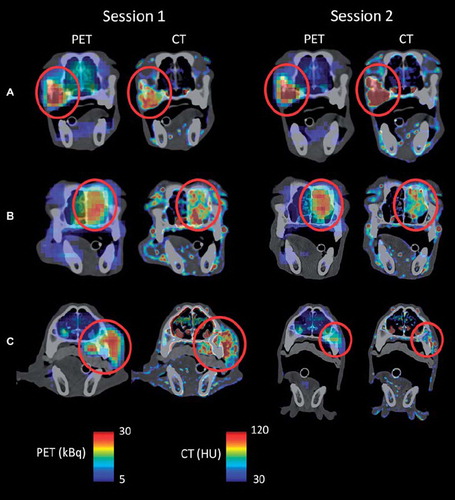
Figure 2. Segmented tumor uptake regions following region growing in FDG-PET (light green) and DCECT (blue) images obtained one minute post injection. The intersection of the regions is given in red. Only the central coronal plane of the tumor is shown.
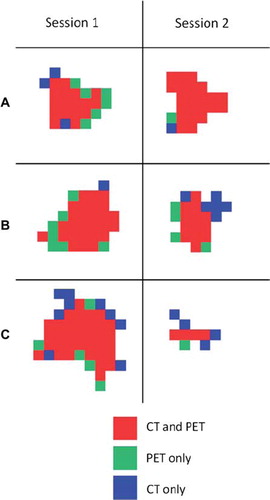
Figure 3. Time-activity/time-enhancement curves for FDG-PET and DCECT, respectively, for patients A–C at imaging sessions 1 and 2. The curves were obtained by extracting the mean uptake within the tumor (corresponding to UV∩;) at each time point post injection. Data were further normalized to the mean uptake over the time period in question. The bars indicate the upper and lower quartile of the uptake distribution within the tumor.
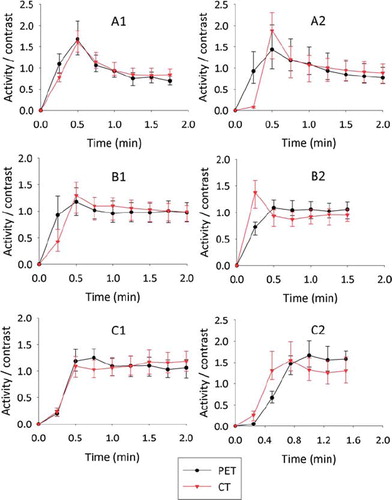
Table II. Uptake volumes (UVs) following region growing in FDG-PET and DCECT images obtained one minute post injection for patient A–C at imaging sessions 1 and 2 (prior to and after fractionated radiotherapy). UV∩is the intersection of UVPET and UVCT. Dice's similarity coefficient for UVPET and UVCT, the maximum spatial correlation between FDG-PET and DCECT (within UV∩) and the temporal correlation is also given.
Figure 4. Central coronal FDG-PET and DCECT images of a tumor obtained at different time points post injection (left). All PET and CT voxel values within the entire tumor are plotted against each other (right). The solid line is a first order linear regression, while the r-values represent Pearson's correlation coefficient, indicating the degree of spatial correlation. The example is shown for patient B at imaging session 1.
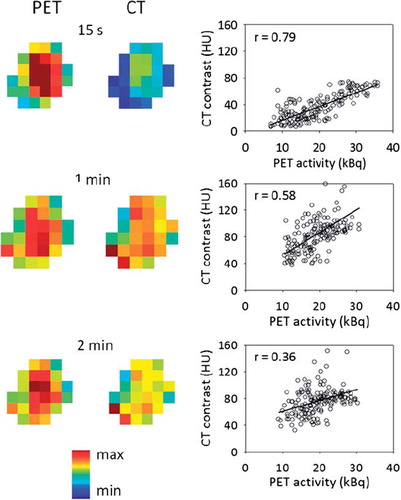
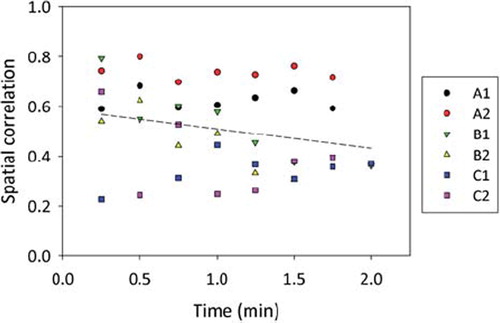
Figure 5. The dependence of the spatial correlation between FDG-PET and DCECT voxel values within the tumor on time post injection. Data for individual patients (A–C) at given imaging session (1 and 2) are shown. The dashed line indicates a first order linear regression on the pooled data.