Figures & data
Table I. Constraints on dose to ORs. Dmax is the maximal allowed dose for the organ, Dmean the maximal mean dose allowed for the tissue and VD the maximal volume of the organ receiving at least the dose D defined as a percentage of the entire volume or a fixed number. For the oesophagus V(BED2Gy = 66Gy) is the volume receiving at least a biologically equivalent dose in 2 Gy fractions of 66 Gy calculated with an α/β = 10.
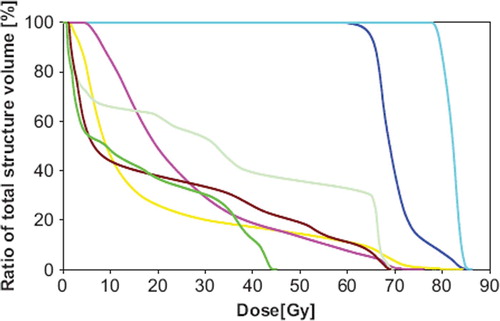
Figure 1. Delineation, beam configuration and isodose curves for case 8, with a. showing a transversal and b. a sagittal view of the tumour on an image blended between the mid-ventilation scan of the 4D-CT and the PET scan. The blue curve is the PTV. The orange curve is 40% of the maximal tumour SUV and adding a 5 mm isotropic margin to this yields PTV-boost represented by the cyan curve. The heart (magenta), the oesophagus (light green) and the spinal canal (green) are close to the target. Part c. shows the transversal and d. the sagittal view with beam configuration and isodose levels. The isocenters of the fields are represented by a yellow line. The plan consisted of four coplanar beams (field number 1–4) and three non-coplanar beams (field number 5–7). The orange isodose curve is 95% of the 82 Gy prescribed to PTV-boost, while the magenta is 95% of 68 Gy (BED2Gy = 66) prescribed to PTV. The red 30 Gy isodose curve shows the conformity of the plan.
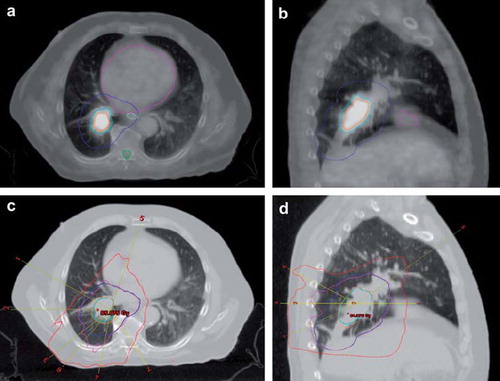
Table II. Tumour characteristics, dose escalation level obtained and lung dose. For the description of the tumour location the following abbreviations are used. Side: L/R is left/right, lobe: L/M/U is lower/middle/upper and position: C/P is central/peripheral. The lung volume used is the lung excluding the GTV.
Figure 2. Dose volume histograms for case 8 of the PTV (blue), PTV-boost (cyan), oesophagus (light green), heart (magenta), trachea (brown), spinal canal (green) and total lung volume (yellow).