Figures & data
Figure 1. a) PMMA phantom; b) PMMA components with cavities for the alanine pellets.
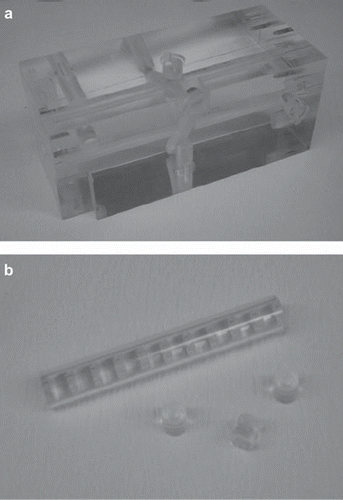
Figure 2. a) Liver tissue with lamellas; b) alanine pellets and gold foils sealed in PE foil.
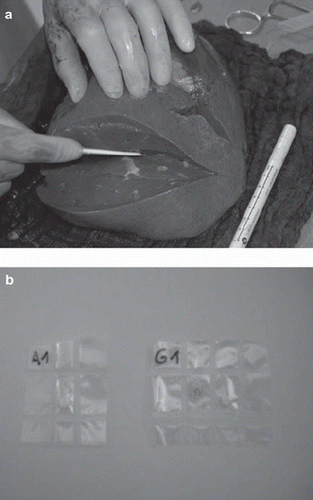
Figure 3. Total dose values DAlanine in Gy for the phantom experiment grey diamonds: measured by the NPL; black squares: calculated by FLUKA.
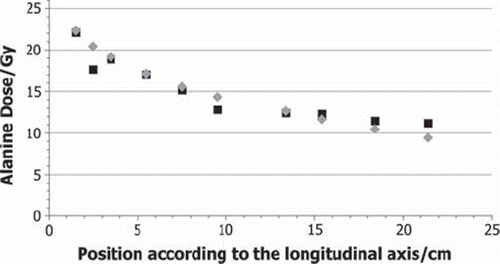
Figure 4. Total dose values DAlanine in Gy for the liver experiment grey diamonds: measured by the NPL; black squares: calculated by FLUKA.
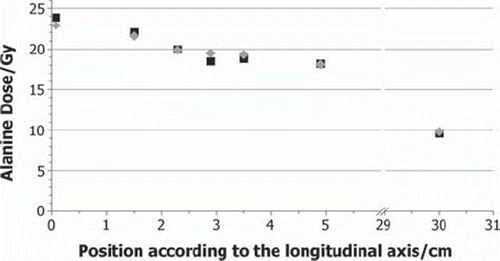
Figure 5. Calculated segmentation of the Total dose DAlanine (black squares) into the neutron (grey diamonds) and the photon (white triangles) component for the phantom experiment.
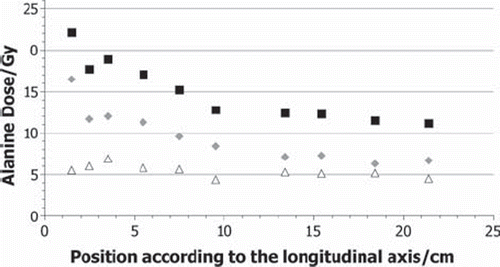
Figure 6. Calculated segmentation of the total dose DAlanine (black squares) into the neutron (grey diamonds) and the photon (white triangles) component for the liver experiment.
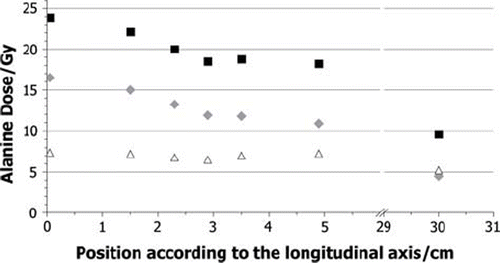
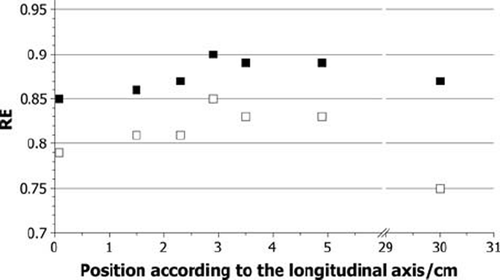
Figure 7. Calculated RE values for neutrons only (white squares) and for the total dose of neutrons and gammas from the reactor core (black squares) in the phantom experiment.
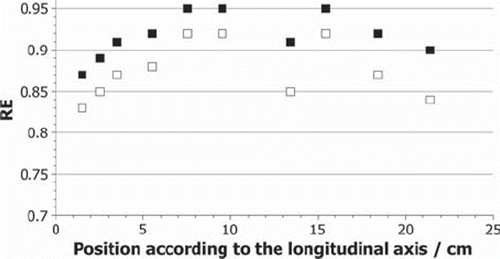
Figure 8. Calculated RE values for neutrons only (white squares) and for the total dose of neutrons and gammas from the reactor core (black squares) in the liver experiment.