1,572
Views
27
CrossRef citations to date
0
Altmetric
Research Article

Monte Carlo calculations of absorbed doses in tumours using a modified MOBY mouse phantom for pre-clinical dosimetry studies

, , &
Pages 973-980 | Received 14 Mar 2011, Accepted 14 Apr 2011, Published online: 18 Jul 2011

Figures & data

Figure 1. Dorsal view of the generated Moby phantom, showing the four different tumour locations on the left and right flanks and thighs.
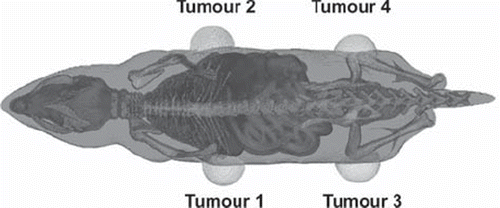
Figure 1. Dorsal view of the generated Moby phantom, showing the four different tumour locations on the left and right flanks and thighs.

Table I. Predominant emissions from isotopes in this study.

Figure 2. Self–absorbed fraction for tumour location 2 (right flank) as a function of energy for different tumour masses, for electrons (A) and photons (B).
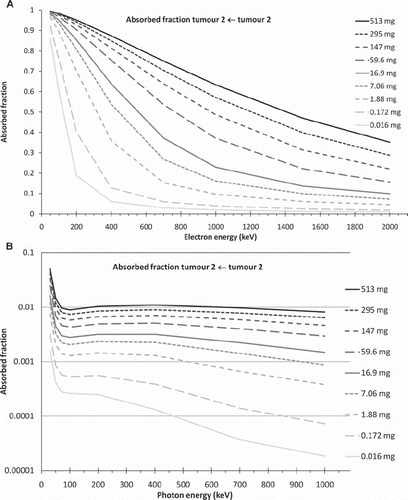
Figure 2. Self–absorbed fraction for tumour location 2 (right flank) as a function of energy for different tumour masses, for electrons (A) and photons (B).

Figure 3. The ratio of tumour self–dose to tumour total dose from the radionuclides studied for tumour location 1 (left flank) (A) and tumour location 3 (left thigh) (B), for a cumulated activity concentration ratio tumour:liver:kidney:remainder of 10:10:10:1 in the 34 g mouse phantom.
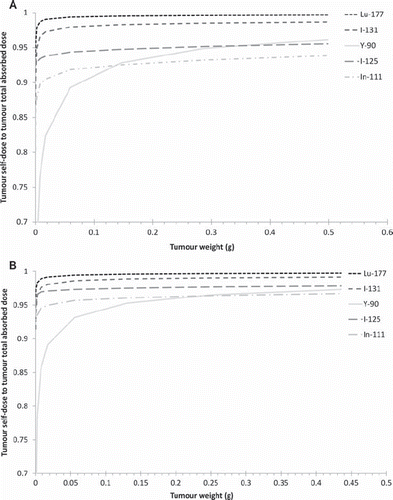
Figure 3. The ratio of tumour self–dose to tumour total dose from the radionuclides studied for tumour location 1 (left flank) (A) and tumour location 3 (left thigh) (B), for a cumulated activity concentration ratio tumour:liver:kidney:remainder of 10:10:10:1 in the 34 g mouse phantom.

Figure 4. The ratio of the tumour self–dose to the tumour total dose from the studied radionuclides for tumour location 1 (left flank) (A) and tumour location 3 (left thigh) (B), for a cumulated activity concentration ratio tumour:liver:kidney:remainder of 10:10:10:0 in the 34 g mouse phantom.
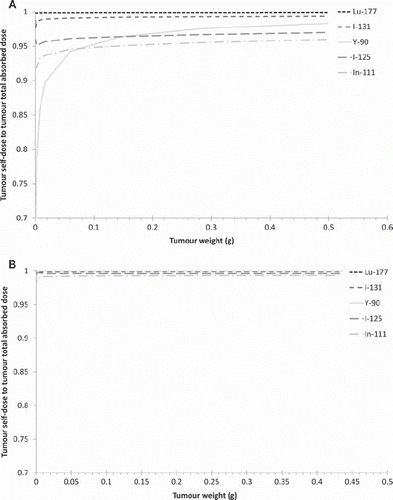
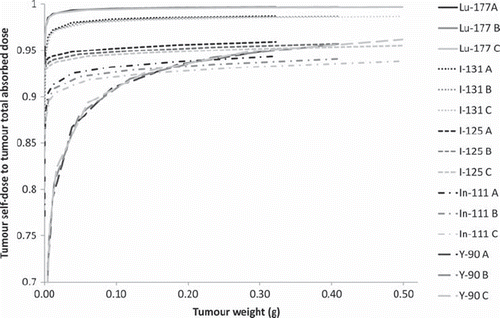
Figure 4. The ratio of the tumour self–dose to the tumour total dose from the studied radionuclides for tumour location 1 (left flank) (A) and tumour location 3 (left thigh) (B), for a cumulated activity concentration ratio tumour:liver:kidney:remainder of 10:10:10:0 in the 34 g mouse phantom.
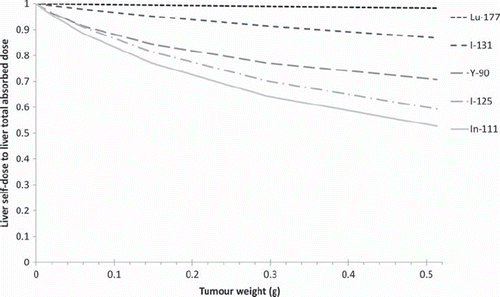
Figure 5. The self-dose: total dose ratio from the studied radionuclides for tumour location 1 (left flank) for the three body weights: A = 22 g, B = 28 g and C = 34 g. The cumulated activity concentration ratio tumour:liver:kidney:remainder in A (left) is 10:10:10:1.

Figure 5. The self-dose: total dose ratio from the studied radionuclides for tumour location 1 (left flank) for the three body weights: A = 22 g, B = 28 g and C = 34 g. The cumulated activity concentration ratio tumour:liver:kidney:remainder in A (left) is 10:10:10:1.

Figure 6. The liver self-dose: total liver absorbed dose ratio for the studied radionuclides and tumour at location 1 (left flank) for the 34 g mouse phantom. The cumulated activity concentration ratio tumour: liver is 100:1.

Figure 6. The liver self-dose: total liver absorbed dose ratio for the studied radionuclides and tumour at location 1 (left flank) for the 34 g mouse phantom. The cumulated activity concentration ratio tumour: liver is 100:1.

Reprints and Corporate Permissions

Please note: Selecting permissions does not provide access to the full text of the article, please see our help page How do I view content?

To request a reprint or corporate permissions for this article, please click on the relevant link below:

Academic Permissions

Please note: Selecting permissions does not provide access to the full text of the article, please see our help page How do I view content?

Obtain permissions instantly via Rightslink by clicking on the button below:

If you are unable to obtain permissions via Rightslink, please complete and submit this Permissions form. For more information, please visit our Permissions help page.