Figures & data
Figure 1. RBE-LET plot for V79 cells A) For carbon ions. B) For carbon ions, LET below 100 keV/μm. The solid line represents the regression line (RBE = 0.709 + (0.0308 *LET)). C) For additional particle types. D) For additional particle types, LET below 100 keV/μm. The solid line represents the regression line (RBE = 0.915 + (0.0293 *LET)).
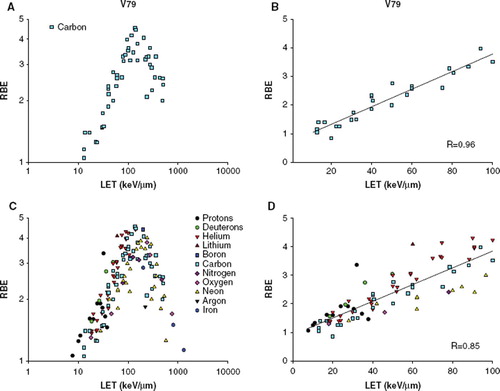
Figure 2. RBE-LET plot for CHO cells A) For carbon ions. B) For carbon ions, LET below 100 keV/μm. The solid line represents the regression line (RBE = 1.258 + (0.0169 *LET)). C) For additional particle types. D) For additional particle types, LET below 100 keV/μm. The solid line represents the regression line (RBE = 1.243 + (0.0160 *LET)).
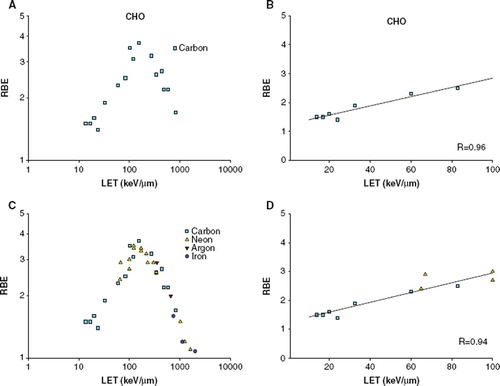
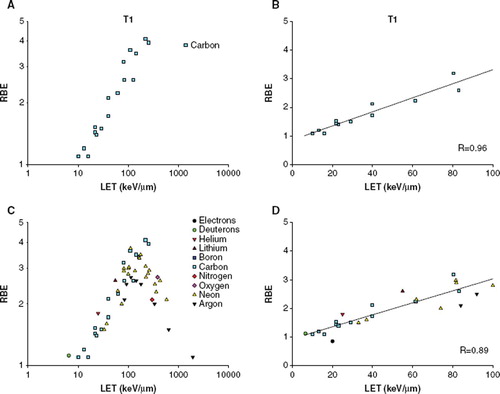
Figure 3. RBE-LET plot for T1 cells A) For carbon ions. B) For carbon ions, LET below 100 keV/μm. The solid line represents the regression line (RBE = 0.863 + (0.0245* LET)). C) For additional particle types. D) For additional particle types, LET below 100 keV/μm. The solid line represents the regression line (RBE = 0.941 + (0.0209 *LET)).