Figures & data
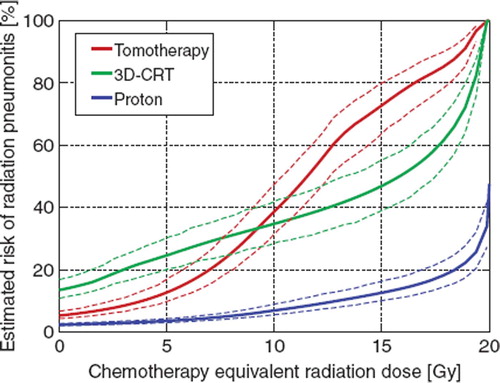
Figure 1. An illustrative case of the intensity modulated photon plan (left) and proton plan (right). The Tomotherapy plan provides very high conformality at the expense of large low dose volumes of the lung. The proton IMPT plan, however, provides conformal target coverage with very little exposure of the residual lung. The bold purple line is the target volume prescribed to 60 Gy.
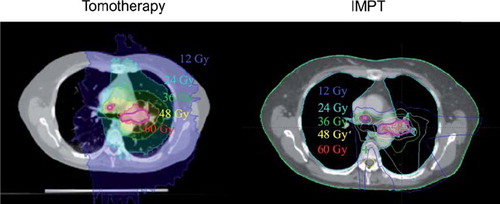
Table I. Mean and range of dose-volume metrics for the three types of dose plans and the mean and range of the NTCP as calculated with the critical volume model with D50 = 20 Gy and k = infinity. CERD, chemotherapy equivalent radiation dose; MLD, mean lung dose; Vx, volume of lung receiving x Gy. All values are corrected for fractionation with α/β = 4 Gy for the residual lung. Note that V20 is monotonically correlated with NTCP. Also, V10 with CERD = 0 Gy is equal to V20 at CERD = 10 Gy.
Figure 2. The estimated risk of radiation pneumonitis versus chemotherapy equivalent dose using the critical volume model. The solid lines indicate average risk and the dotted lines indicate the 68% confidence interval of the mean as derived by bootstrap resampling.