Figures & data
Table I. Summary of patient characteristics and localization of the tumors included in the study.
Figure 1. Fused transaxial PET/CT images of patients 1–4, with patient 1 presenting two lesions (a and b). The display range of SUV values was manually adjusted for each patient. Images obtained following breath hold (BH, left) and free breathing (FB, right) are shown.
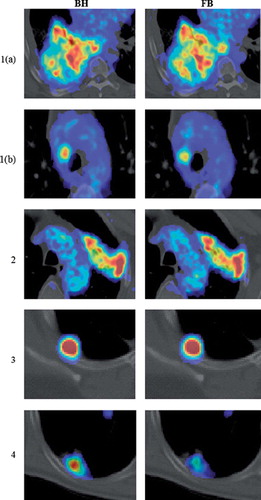
Figure 2. Segmented tumors in patients 1–4 using region growing. Patient 1 presented two lesions (a and b). Segmentation was performed in images obtained both during breath hold (BH blue) and free breathing (FB, green). The intersection of the regions is given in red.
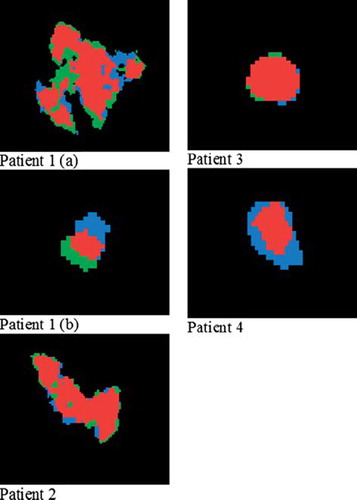
Table II. Ratio between tumor volumes for breath hold (BH) and free breathing (FB) images. Threshold represents the SUV value chosen as lower threshold for the region growing of tumor volumes. Tv corresponds to the resulting tumor volume.
Table III. Standard uptake values (SUVmax/mean) and standard deviations (S. D.) in defined tumor regions.
Table IV. Median gradients in the mediolateral (x), dorsoventral (y) and caudocranial (z) directions for tumor volumes in breath hold (BH) and free breathing (FB) images.
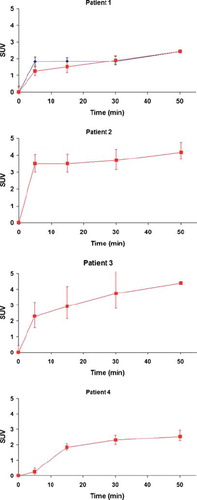
Figure 3. Median SUV within the tumor volume as a function of time for patients 1–4. For patient 1, two lesions (a, red squares and b, blue squares) were evaluated. The error bars indicate the upper and lower quartile of the SUV distribution within the tumor.