Figures & data
Figure 1. Transversal images through the level of the basal ganglia of a patient with glioblastoma multiforme. The T1 weighted MR after contrast injection (left image) show a central area in the left temporal lobe with contrast enhancement. The metabolic activity in temperature scale using FDG-PET (right image). The tumor region – the large red region with the highest uptake – extends far beyond the MR contrast enhanced area in all directions, as shown in the fused images (centre image).
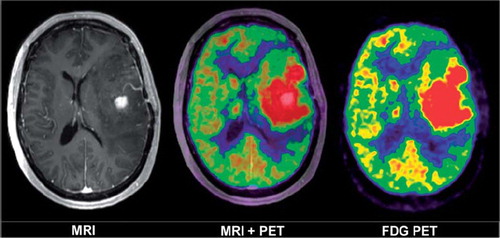
Figure 2. Left: transversal CT image with overlaid tractography structure in gold. The hippocampi and brainstem are displayed in purple and green, respectively. Right: a 3D fiber tract structure seen anteriorly with eyes in red and green for the same patient. Fibers are displayed in red, green and blue in the images. The color coding is by convention red for commissural (transversal) tracts, blue for fibers running superoinferiorly and green for fibers running in ventralodorsaly. The fibers were disrupted and displaced by the tumor, as indicated by the lack of symmetry in both images.
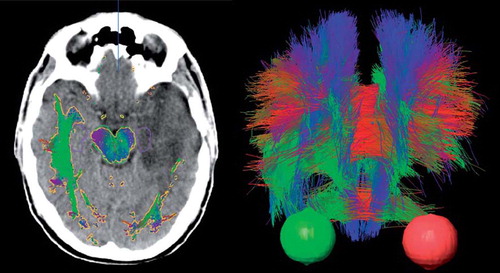
Figure 3. Doses to the organs at risk specifically evaluated in this study. Average doses for the 15 patients (Fiber Objects were averaged for 5 patients) are presented.
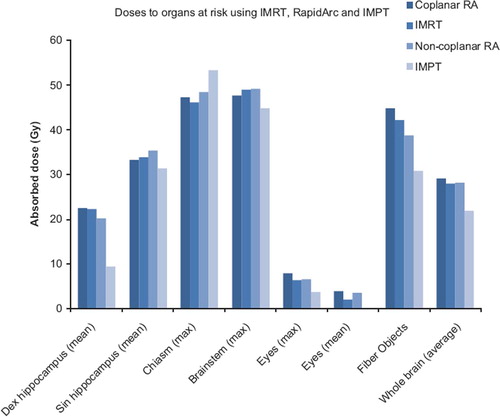
Figure 4. The ranges of the standard deviations of the absorbed doses to the Planning Target Volumes for the Intensity Modulated photon Radiation Therapy (IMRT), coplanar RapidArc (RA), non-coplanar RA and Intensity Modulated Proton Therapy (IMPT) techniques are shown as lines in the diagram. The extent of the boxes represent the range of the mid third of the standard deviations for each radiation therapy technique.
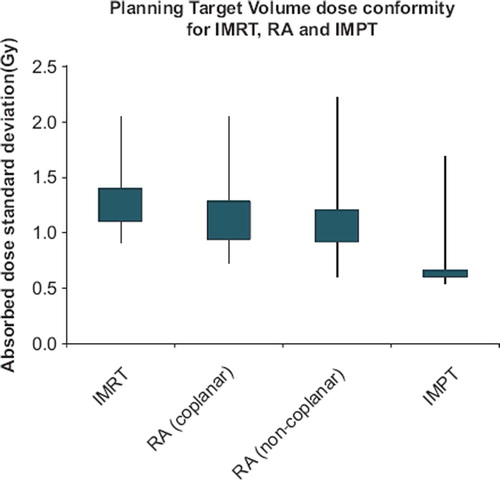
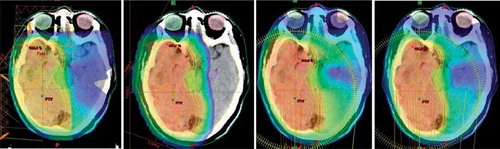
Figure 5. Example dose distribution for one patient: IMRT (left), IMPT (mid-left), RA (mid-right) and non-coplanar RA (right). The color-wash shows the dose distribution in temperature scale from 110% to 10% of the prescription level (60 Gy).