1,887
Views
62
CrossRef citations to date
0
Altmetric
Research Article

The accuracy of absorbed dose estimates in tumours determined by Quantitative SPECT: A Monte Carlo study

&
Pages 981-989 | Received 08 Apr 2011, Accepted 26 Apr 2011, Published online: 18 Jul 2011

Figures & data

Table I. Calculated activity normalised to the true activity obtained from quantitative SPECT images for total body and within the VOI for each of tumour 1–3. “True” represent the correct activity.

Figure 1. Absorbed dose rate images calculated from a) the assumption of local average energy deposition from charged particles within the voxel where the decay occur (EA-SPECT), b) a full Monte Carlo simulation of the energy deposition using activity distribution from quantitative SPECT images (MC-SPECT) and c) a full Monte Carlo from the true high-resolution activity distribution (MC-TRUE).
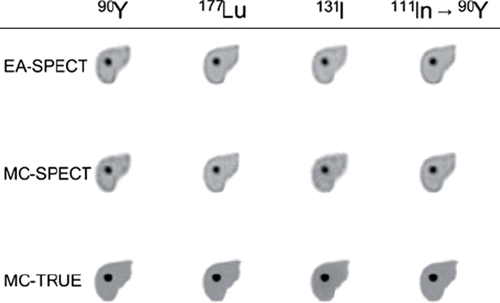
Figure 1. Absorbed dose rate images calculated from a) the assumption of local average energy deposition from charged particles within the voxel where the decay occur (EA-SPECT), b) a full Monte Carlo simulation of the energy deposition using activity distribution from quantitative SPECT images (MC-SPECT) and c) a full Monte Carlo from the true high-resolution activity distribution (MC-TRUE).

Figure 2. Dose-rate Volume Histograms (DrVH) for the case with activity located only in the tumours. Solid lines represent EA-SPECT, short dashed lines represent MC-SPECT and long dashed lines represent MC-TRUE. Note that the range on the x-scale is not equal for the different graphs but remains the same between this figure and .
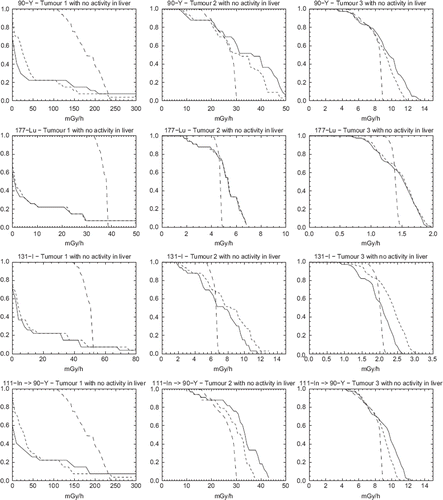
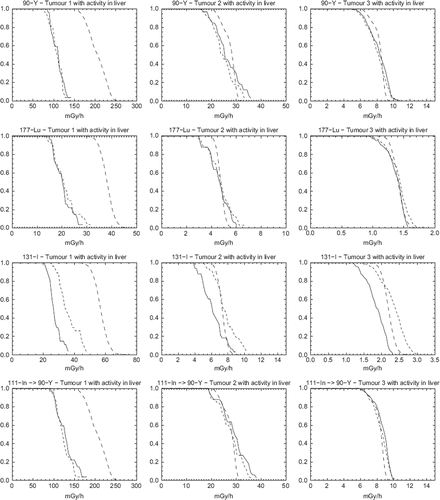
Figure 2. Dose-rate Volume Histograms (DrVH) for the case with activity located only in the tumours. Solid lines represent EA-SPECT, short dashed lines represent MC-SPECT and long dashed lines represent MC-TRUE. Note that the range on the x-scale is not equal for the different graphs but remains the same between this figure and Figure 3.

Figure 3. Dose-rate Volume Histograms (DrVH) for the case with activity both located in the tumour and in the surrounding liver and with a tumour-to-liver activity concentration of 5:2. Solid lines represent EA-SPECT, dotted lines represent MC-SPECT and dashed lines represent MC-TRUE.

Figure 3. Dose-rate Volume Histograms (DrVH) for the case with activity both located in the tumour and in the surrounding liver and with a tumour-to-liver activity concentration of 5:2. Solid lines represent EA-SPECT, dotted lines represent MC-SPECT and dashed lines represent MC-TRUE.

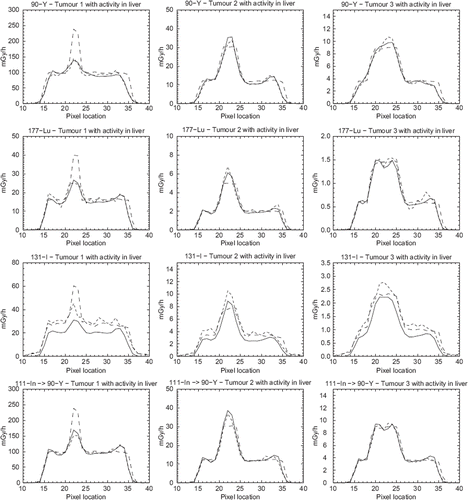
Figure 4. Profiles through the tumours for case b) with activity present in the liver are shown for the four radionuclides. Solid lines represent EA-SPECT, dotted lines represent MC-SPECT and dashed lines represent MC-TRUE.

Figure 4. Profiles through the tumours for case b) with activity present in the liver are shown for the four radionuclides. Solid lines represent EA-SPECT, dotted lines represent MC-SPECT and dashed lines represent MC-TRUE.

Reprints and Corporate Permissions

Please note: Selecting permissions does not provide access to the full text of the article, please see our help page How do I view content?

To request a reprint or corporate permissions for this article, please click on the relevant link below:

Academic Permissions

Please note: Selecting permissions does not provide access to the full text of the article, please see our help page How do I view content?

Obtain permissions instantly via Rightslink by clicking on the button below:

If you are unable to obtain permissions via Rightslink, please complete and submit this Permissions form. For more information, please visit our Permissions help page.