Figures & data
Figure 1. Left: Photo showing the experiment setup. The tungsten sphere at the tip of the electromagnetic transmitter is marked by the red laser X. Right: Schematic showing the experiment setup. A trajectory file is uploaded to the motion stage on which is mounted a Styrofoam phantom with the electromagnetic transmitter on top. A tracking PC receives the position localization signal from the transponder software and instructs the DMLC to adjust accordingly.
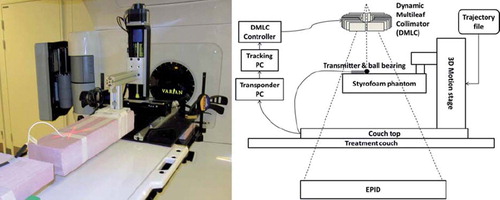
Figure 2. Stability of the transponder signal. The vertical bars show the range of measured displacement for a static motion stage in a 4 s period prior to all lung tumor trajectory experiments. The 12 vertical bars correspond to the four lung tumor trajectories for each of the three treatment type experiments; arc, static AP, and static lateral.
Figure 3. Example of 3D geometric accuracy in a tracking experiment of a baseline shifted lung tumor trajectory (L1 in and ) in room coordinates. Shown curves are phantom motion (blue), trajectory as measured by the electromagnetic transponder at the time of localization (red), and trajectory as predicted at the time of beam correction (i.e. after 140 ms). The numbers specify the root-mean-square position estimation error before/after prediction.
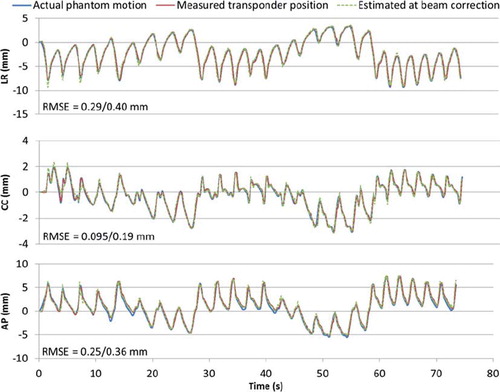
Table I. Results of experiments: mean rms of position estimation errors in mm.
Figure 4. Tracking accuracy observed in MV images in the same experiment as shown in . Trajectories are shown for the target (blue), visualized by the shadow of the tungsten sphere on the portal MV images, and for the center of the circular field shaped by the DMLC aperture (red). The green curve is the tracking error, i.e. the difference between the target and the DMLC aperture positions.
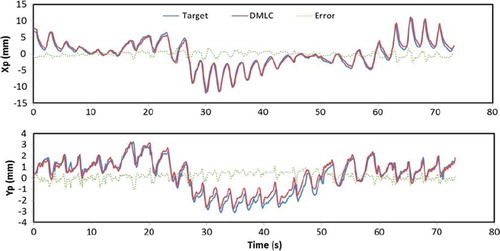
Figure 5. 2D root-mean-square errors with (black circles) and without (gray squares) tracking for arc treatments. Results were similar for static treatments (see ). The 2D rms target localization errors at time of localization and at time of beam correction are also shown. Tumor trajectory labels are explained in .
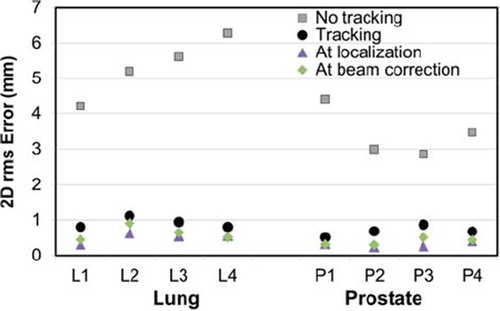
Table II. Results of experiments: rms of tracking errors in mm.