Figures & data
Table I. Histological review of the 144 osteosarcomas included in the analysis by five-year periods.
Table II. Demographic data by five-year time periods.
Table III. Description of tumour, patient and treatment characteristics of the 116 patients with local disease, and the corresponding estimates of 10-year metastases-free and sarcoma-specific survival.
Figure 1. Sarcoma-specific survival by five-year periods for the whole study population: 1991–1995 (blue), 1996–2000 (green), 2001–2005 (brown).
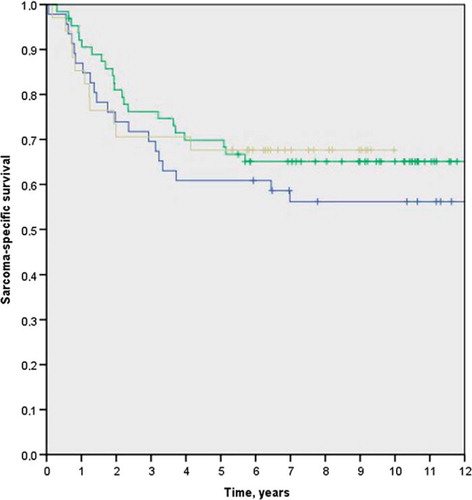
Figure 2. Event-free survival for the 116 patients with local disease at presentation.
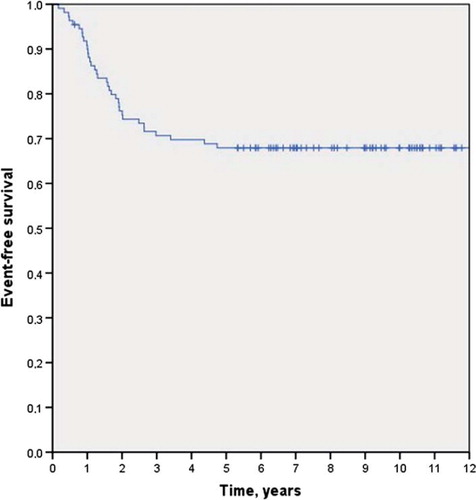
Table IV. Multivariate analyses of prognostic factors for metastases-free survival and sarcoma-specific survival.