Figures & data
Table I. Patients’ characteristics.
Figure 1. Ghrelin expression in invasive breast cancer tissue was analyzed by immunohistochemistry. Representative images of ghrelin with A (non-immunoreactive), B (weak), C (moderate) and D (strong) immunostaining. Scale bar = 100 μm.
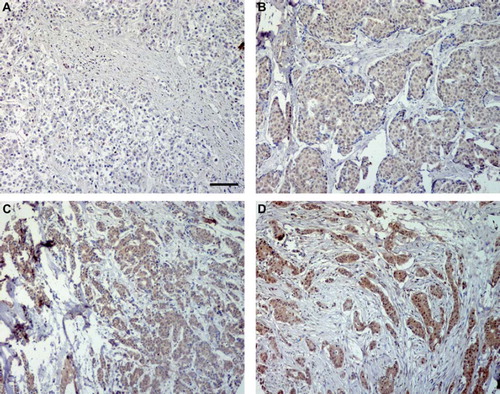
Table II. Results from the immunohistochemical scorings.
Table III. Ghrelin and obestatin expression in breast cancer in relation to clinicopathologic variables.
Table IV. Univariate analysis of prognostic parameters.
Table V. Multivariate analysis of prognostic markers.
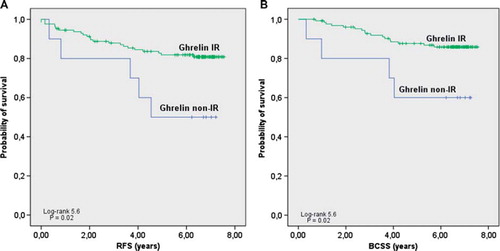
Figure 2. Survival among breast cancer patients by ghrelin expression. Ghrelin immunoreactive, scores 1–3; ghrelin non-immunoreactive, score 0. A, RFS according to ghrelin. B, BCSS according to ghrelin.
Supplemental material