Figures & data
Table I. Clinical characteristics of human subjects.
Figure 1. Plots from UPLC/QTOF/MS and SIMCA-P. A and B showed the typical total ion current (TIC) chromatograms of plasma samples obtained from an EOC patient and a normal control, respectively, using UPLC/QTOF/MS; C shows the PLS-DA score plot for the first two components (t[Citation1], t[Citation2]), which reveals that a considerable separation was achieved between EOC plasma samples (the red triangle) and normal controls (the black box). D depicts the PLS-DA scatter-plots results. The candidate biomarkers are marked with red square.
![Figure 1. Plots from UPLC/QTOF/MS and SIMCA-P. A and B showed the typical total ion current (TIC) chromatograms of plasma samples obtained from an EOC patient and a normal control, respectively, using UPLC/QTOF/MS; C shows the PLS-DA score plot for the first two components (t[Citation1], t[Citation2]), which reveals that a considerable separation was achieved between EOC plasma samples (the red triangle) and normal controls (the black box). D depicts the PLS-DA scatter-plots results. The candidate biomarkers are marked with red square.](/cms/asset/f3d77893-9684-484f-b7d1-a7ab263d7c9c/ionc_a_648338_f0001_b.jpg)
Table II. Differential metabolites derived from PLS-DA analysis.
Figure 2. Box plots of eight typical differential metabolites from newly diagnosed EOC patients (the right box) and normal controls (the left box).
Table III. Adjusted p-value of the metabolic biomarkers in logistic regression models.
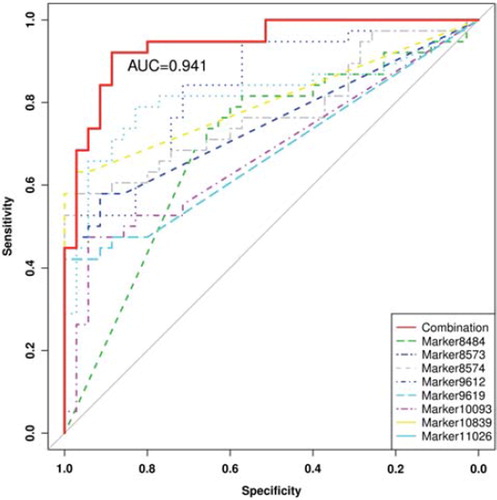
Figure 3. The area under empirical ROC curve of the combination of the eight candidate biomarkers, Marker8484, Marker8573, Marker8574, Marker9612, Marker9619, Marker10093, Marker10839 and Marker11026 alone in the external validation cohort.