Figures & data
Table I. Patient and tumor characteristics.
Table II. Characteristics of the initial dose plans. Median values are given, with ranges in brackets.
Figure 1. Registered displacement of the target according to the initial set-up in the SBF compared to the planning CT, as obtained from the CT-CBCT registration. Results in the vertical, lateral and longitudinal directions are displayed for all treatment fractions, 90 in total.
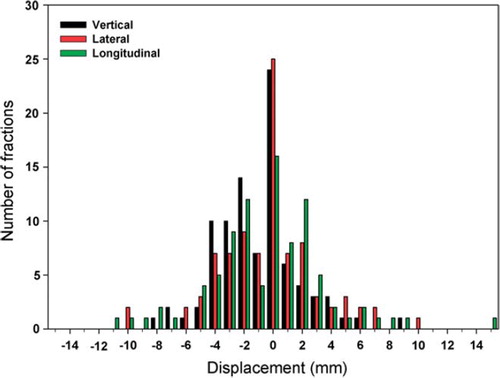
Figure 2. Example of the four plans for a patient. The target volumes appear as solid lines in the axial view and as dotted lines in the reconstructed sagittal and coronal views. Dose isoshades are also displayed in the slices, where the yellow isoshade is the prescription dose (15 Gy).
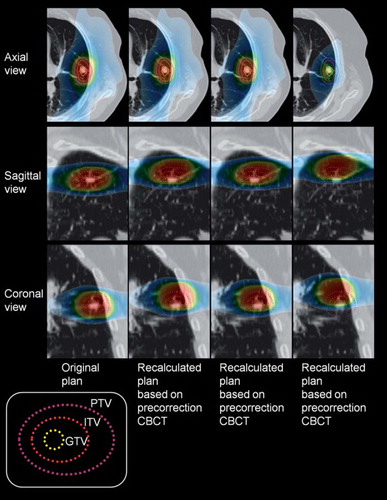
Figure 3. Minimum doses to the ITV for all four plans for all patients. The 15 Gy level indicates the prescription dose.
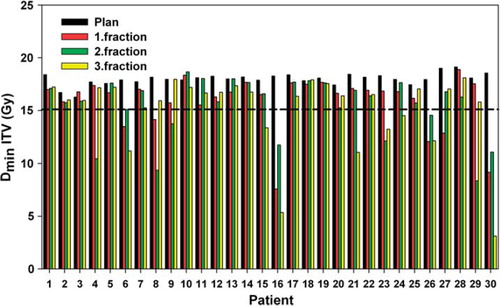
Figure 4. The ITV minimum dose as a function of the absolute displacement vector. Results for all treatment fractions (n = 90) are displayed, where three fractions are summed for each patient (N = 30).