Figures & data
Table I. Patients’ baseline characteristics.
Figure 1. Summary of best radiographic responses for the 28 evaluable glioblastoma multiforme. Horizontal grey lines represent 1 25% and 2 50% change from baseline.
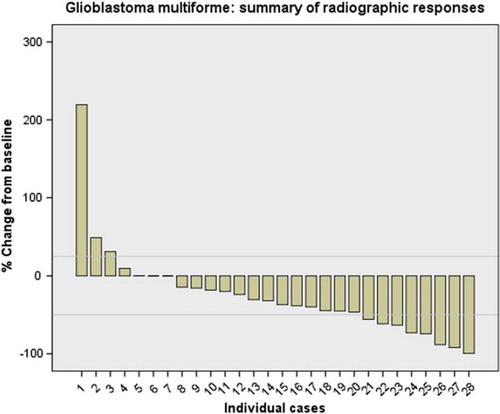
Table II. Clinical responses and outcomes for the glioma population. 95% confidence intervals are noted in parentheses.
Table III. Responses and outcomes for individuals in the non-glioma population.
Table IV. Odds ratio of response for different clinical parameters. No statistically significant associations were found.
Table V. Toxicity. All values indicate percentage of valid data. Only changes from baseline are reported.