Figures & data
Table 1. Volumes of interest and corresponding planning criteria.
Table 2. Dose-volume results of relevant structures and corresponding NTCP values for swallowing dysfunction.
Figure 1. Sagittal and axial representation of dose distributions with standard (ST)-intensity-modulated radiotherapy (IMRT), swallowing-sparing (SW)-IMRT and 7-beam SW-intensity-modulated proton therapy (IMPT) in a sample patient.
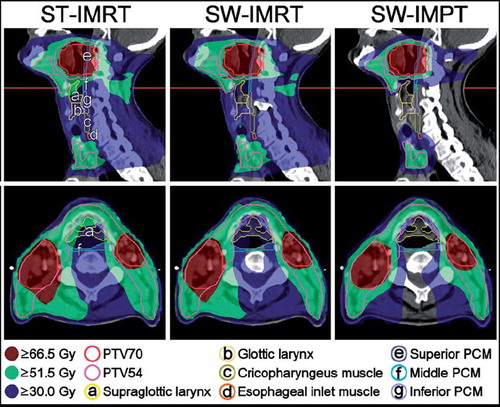
Figure 2. Mean dose delivered to the superior pharyngeal constrictor muscle (PCM) (A) and supraglottic larynx (B), and corresponding normal tissue complication probability (NTCP) of physician-rated RTOG grade 2–4 swallowing dysfunction (C) with standard (ST)-intensity-modulated radiotherapy (IMRT), swallowing-sparing (SW)-IMRT and SW-intensity-modulated proton therapy (IMPT). In each figure, patients were re-sorted according to the corresponding value with ST-IMRT.
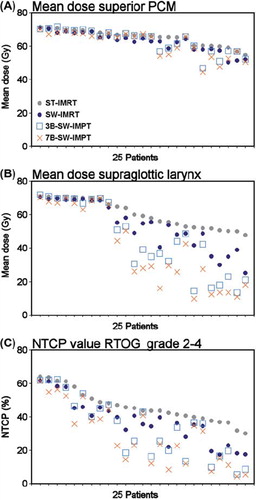
Figure 3. Calculated normal tissue complication probability (NTCP) values of physician-rated RTOG grade 2–4 swallowing dysfunction in a patient with a considerable benefit. According to our models [Citation7], the NTCP with standard (ST)-intensity-modulated radiotherapy (IMRT), swallowing-sparing (SW)-IMRT and SW-intensity-modulated proton therapy with 7 beams (7B-SW-IMPT) depends not only on the mean dose to the superior pharyngeal constrictor muscle (PCM), but also on the mean dose to the supraglottic larynx region.
![Figure 3. Calculated normal tissue complication probability (NTCP) values of physician-rated RTOG grade 2–4 swallowing dysfunction in a patient with a considerable benefit. According to our models [Citation7], the NTCP with standard (ST)-intensity-modulated radiotherapy (IMRT), swallowing-sparing (SW)-IMRT and SW-intensity-modulated proton therapy with 7 beams (7B-SW-IMPT) depends not only on the mean dose to the superior pharyngeal constrictor muscle (PCM), but also on the mean dose to the supraglottic larynx region.](/cms/asset/e6ee7417-ecb6-4a4f-a75e-e7fe87234fe7/ionc_a_692885_f0003_b.jpg)
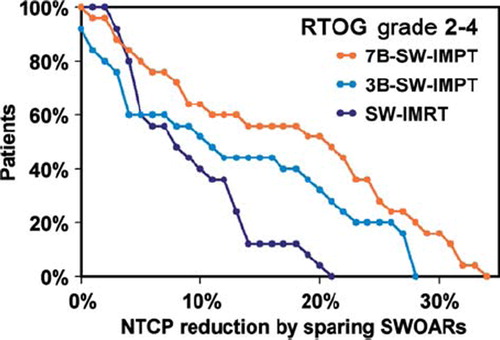
Figure 4. Potential reductions in the normal tissue complication probability (NTCP) of physician-rated RTOG grade 2–4 swallowing dysfunction as achieved by swallowing-sparing intensity-modulated radiotherapy (SW-IMRT) or intensity-modulated proton therapy with 3 or 7 beams (3B-SW-IMPT and 7B-SW-IMPT, respectively) relative to standard (ST)-IMRT. Cumulative plots are shown.