Figures & data
Figure 1. Altered fluorescent intensity in peritoneal cavity during 24 hour period. Mice from both control and irradiated groups were ventrally scanned before and after injection i.p. of chitosan/Cy5-siRNA. Only irradiated mice are presented. (A), before injection (Before Inj.); (B), 1 hour post-injection (1 h P.Inj.) and (C) 24 hour period (24 h P.Inj.).
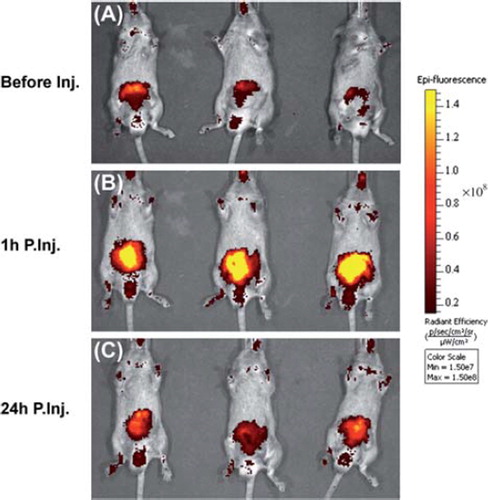
Figure 2. Optical fluorescence imaging of chitosan/Cy5 siRNA nanoparticles in a murine radiation-induced fibrosis model. Mice irradiated 13 days before imaging or without irradiation (Control) (n = 5) were administrated i.p. with chitosan/Cy5 labeled siRNA nanoparticles. Fluorescent optical imaging was performed at distinct time points after injection of fluorescently labeled siRNA/chitosan particles. A, C, E, G, I, K, M and B, D, F, H, J, L, N represent images of three mice from the control group without irradiation and the irradiated group (irradiated 13 days before imaging). Images were taken before and right after injection of chitosan/Cy5-siRNA, as well as one, two, four, six, 24 hours post-injection, respectively.
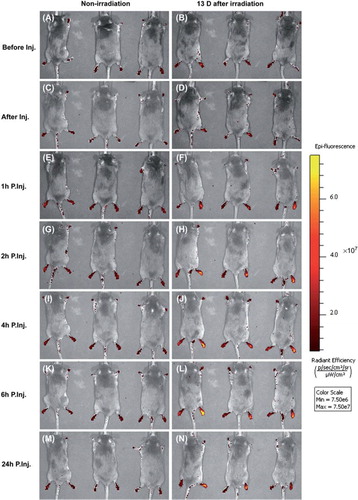
Figure 3. Quantification of the fluorescence signals from the footpads. To quantify the signal intensity of images from , the radiant efficiency [(photons/s/cm2/sr)/(μW/cm2)] was measured using Living Image 4.0 software package. The average value of left and right footpads from each group was presented (mean± SD, n = 5). Student t-test was performed to compare the signal between right and left footpads in irradiated mice, ‘*’ p-value < 0.05 and ‘**’ p-value < 0.01. G1 represents control group for mice without irradiation and G2 represents irradiated group for mice irradiated at right hind leg/paws with dose of 45 Gy for 13 days. L and R represent left and right footpads from each group, respectively. G1-L, G1-R and G2-L were non-irradiated footpads.
![Figure 3. Quantification of the fluorescence signals from the footpads. To quantify the signal intensity of images from Figure 2, the radiant efficiency [(photons/s/cm2/sr)/(μW/cm2)] was measured using Living Image 4.0 software package. The average value of left and right footpads from each group was presented (mean± SD, n = 5). Student t-test was performed to compare the signal between right and left footpads in irradiated mice, ‘*’ p-value < 0.05 and ‘**’ p-value < 0.01. G1 represents control group for mice without irradiation and G2 represents irradiated group for mice irradiated at right hind leg/paws with dose of 45 Gy for 13 days. L and R represent left and right footpads from each group, respectively. G1-L, G1-R and G2-L were non-irradiated footpads.](/cms/asset/df379d8e-b508-4f74-a33f-ff2c2ad5abfa/ionc_a_726373_f0003_b.jpg)
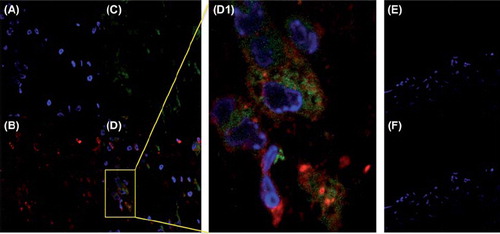
Figure 4. Co-localization of chitosan/Cy3 labeled siRNA nanoparticles and peritoneal macrophages in the irradiated skin of the hind leg. Male mice were irradiated with a dose of 45 Gy or left without irradiation as a control. After 13 days chitosan/Cy3 labeled siRNA nanoparticles were administrated i.p.. Four hours later skin samples were taken from irradiated and non-irradiated leg/paws. These were stained for F4/80, a macrophage marker and examined by confocal laser microscopy. Represented pictures from irradiated tissue are shown as A–D, Cy3 signal (Green) was only observed within F4/80 positive cells (Red), whereas non-irradiated skin did not show signal for Cy3 (E&F, and not shown). D1 represented the enlarged image in selected region (rectangle) from the D. As there was no signal for both macrophage staining and Cy3 fluorescence in non-irradiated skin, they were not shown. Therefore the merge (F) showed same pattern to DAPI one (E). A and E, nuclei are stained using DAPI (Blue); B, macrophages are immunohistochemically stained using F4/80; C, Cy3 signal from siRNA; D and F, pictures are merged.