Figures & data
Table I. Exclusion of colorectal cancer patients who did not undergo curative treatment in 1994–1996 and 2001–2003.
Table II. Demographic characteristics and nodal status of 11 437 patients surgically treated with curative intent for colon and rectal cancer in Norway.
Figure 1. >Excess hazard ratio with 99% confidence intervals (CI) in the 1994–1996 period compared with the 2001–2003 period for different postoperative time intervals (0–2 months, 2–12 months, 1–2 years, 2–3 years, 3–4 years, and 4–5 years). A ratio, 1 indicates a lower mortality in the 2001–2003 period compared with the 1994–1996 period. A. Colon cancer. B. Rectal cancer.
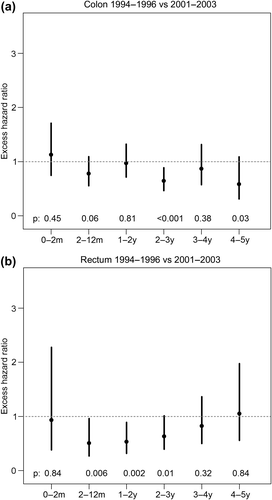
Table III. Excess hazard at different postoperative time intervals during the five-year follow-up period, reported as per excess deaths per 1000 person years. Excess hazard figures are provided for the 1994–1996 and 2001–2003 periods.
Figure 2. Excess hazard ratio with 99% confidence intervals (CI) for colon cancer compared to rectal cancer for different postoperative time intervals (0–2 months, 2–12 months, 1–2 years, 2–3 years, 3–4 years, and 4–5 years). A. 1994–1996 period. B. 2001–2003 period.
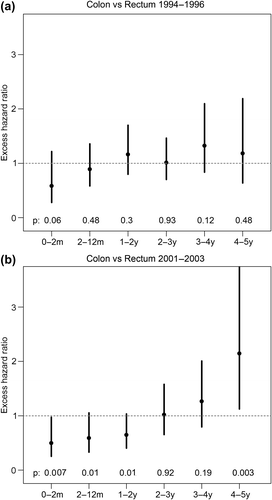
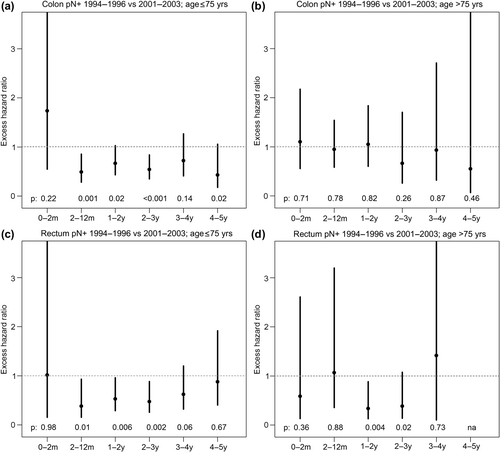
Figure 3. Excess hazard ratio with 99% confidence interval (CI) in the 1994–1996 period compared with the 2001–2003 period for patients with lymph node-positive disease during different postoperative time intervals (0–2 months, 2–12 months, 1–2 years, 2–3 years, 3–4 years, and 4–5 years) after curative surgery. For rectal cancer patients aged . 75 years, there were too few incidents to generate a CI for the 4–5 year time interval. A. Colon cancer patients ≤ 75 years. B. Colon cancer patients. 75 years. C. Rectal cancer patients ≤ 75 years. D. Rectal cancer patients . 75 years.