Figures & data
Table I. Baseline patient and treatment variables.
Figure 1. Manual contours throughout a course of follow-up for a patient whose cancer recurred. The solid lines represent consolidative changes, and the dashed lines represent ground glass opacity (GGO).
Figure 2. The standard deviation (SD) of CT density was used as a basic texture measure. Three examples from ground glass opacity of patients in this study, showing the differences in texture with the varying SDs: a) 50.1 HU, b) 85.8 HU, c) 123.4 HU.
Table II. Baseline pre-treatment imaging characteristics.
Figure 3. Cumulative size measures of the consolidative regions throughout follow-up post-SABR; all values are the mean ± 95% CI. a) RECIST and b) 3D volume. *Indicates statistical significance at p ≤ 0.05.
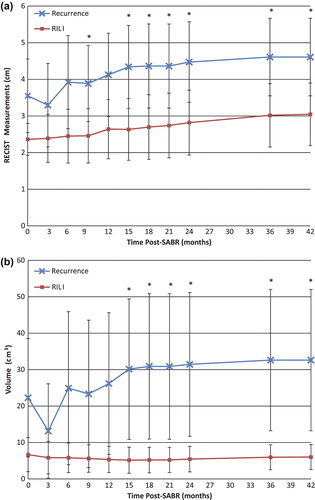
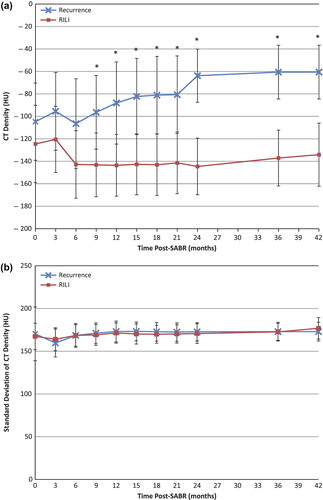
Figure 4. Cumulative appearance measures of the ground glass opacity regions throughout follow-up post-SABR; a) Mean (± 95% CI) CT density, and b) standard deviation (± 95% CI) of CT density. *Indicates statistical significance at p ≤ 0.05.
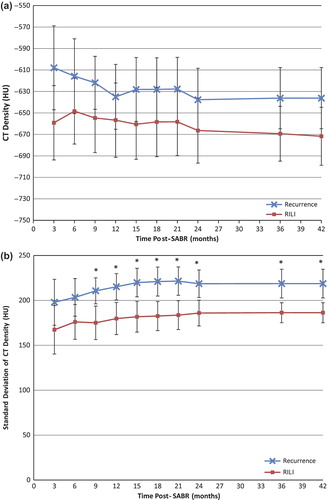
Figure 5. Cumulative appearance measures of the consolidative regions throughout follow-up post-SABR; a) Mean (± 95% CI) CT density, and b) standard deviation (± 95% CI) of CT density. Indicates statistical significance at p ≤ 0.05.