10,033
Views
10
CrossRef citations to date
0
Altmetric
Original Articles

Rapid expansion of T cells: Effects of culture and cryopreservation and importance of short-term cell recovery

, , , &
Pages 978-986 | Received 27 Apr 2012, Accepted 28 Sep 2012, Published online: 06 Nov 2012

Figures & data

Figure 1. The progress flow sheet for the treatment of cells displayed in sequential steps. Isolated lymphocytes from five donors were split into two aliquots. Aliquot 2 was immediately cryopreserved and thawed. Aliquot 1 was cultured for 2 weeks and split into 1a and 1b. Aliquot 1a was expanded and cryopreserved, while aliquot 1b was cryopreserved before expansion. Both aliquots 1a and 1b were cryopreserved after expansion and were allowed to recover for 48 hours after thawing. During the progression of the treatment schedule, each box, representing different time points were analyzed.
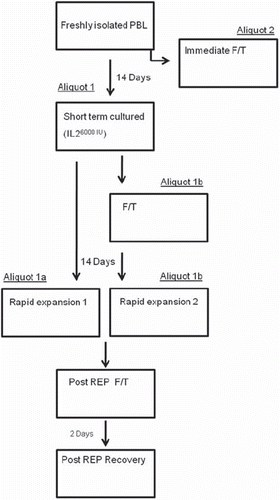
Figure 1. The progress flow sheet for the treatment of cells displayed in sequential steps. Isolated lymphocytes from five donors were split into two aliquots. Aliquot 2 was immediately cryopreserved and thawed. Aliquot 1 was cultured for 2 weeks and split into 1a and 1b. Aliquot 1a was expanded and cryopreserved, while aliquot 1b was cryopreserved before expansion. Both aliquots 1a and 1b were cryopreserved after expansion and were allowed to recover for 48 hours after thawing. During the progression of the treatment schedule, each box, representing different time points were analyzed.

Table I. Primers used in RT-qPCR gene expression analysis.

Table II. Cell viability.

Figure 2. Concentration of intercellular ATP concentration as a marker for metabolic activity and immunocompetence of CD4+ T cell subsets isolated from peripheral blood of healthy donors (a) and TILs isolated from melanoma biopsies (b) was measured with the Immuknow assay. Cells were stimulated with PHA for 24 hours and lysed to release intracellular ATP. Released ATP was measured with a luciferin/luciferase system and a luminometer. (a) Figure showing changes in ATP concentration throughout the protocol of; fresh cells isolated from healthy blood donors (Fresh); cryopreserved and thawed cells (F/T); non-cryopreserved cells cultured for 14 days in high-dose IL-2 (IL-2); cells cultured for 14 days in high-dose IL-2 and then cryopreserved and thawed (IL-2 F/T); non-cryopreserved and cryopreserved day 14 cells after rapid expansion (REP1 and REP2, respectively); REP2 cells after cryopreservation and thawing (Post REP F/T) and REP2 cells allowed to recover for 48 hours after cryopreservation and thawing (Post REP Rec.). F/T (frozen/thawed), gray bars represent non-cryopreserved cells. (b) Immuknow results from cryopreserved TILs from melanoma patients. TILs obtained from six melanoma patients were stimulated with PHA directly after thawing and after 48 hours of recovery. The boxes represent concentrations of intracellular ATP with median, minimum and maximum values (n = 5). Asterisks denote statistical significance where *p ≤ 0.05, **p ≤ 0.01.
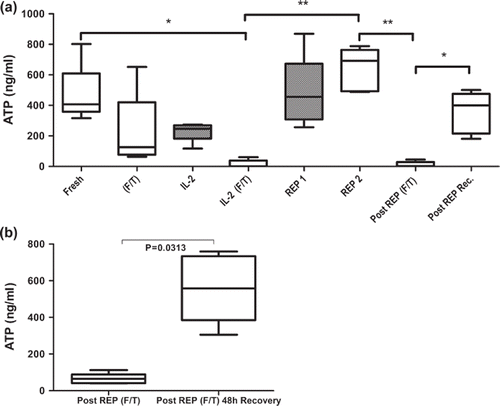
Figure 2. Concentration of intercellular ATP concentration as a marker for metabolic activity and immunocompetence of CD4+ T cell subsets isolated from peripheral blood of healthy donors (a) and TILs isolated from melanoma biopsies (b) was measured with the Immuknow assay. Cells were stimulated with PHA for 24 hours and lysed to release intracellular ATP. Released ATP was measured with a luciferin/luciferase system and a luminometer. (a) Figure showing changes in ATP concentration throughout the protocol of; fresh cells isolated from healthy blood donors (Fresh); cryopreserved and thawed cells (F/T); non-cryopreserved cells cultured for 14 days in high-dose IL-2 (IL-2); cells cultured for 14 days in high-dose IL-2 and then cryopreserved and thawed (IL-2 F/T); non-cryopreserved and cryopreserved day 14 cells after rapid expansion (REP1 and REP2, respectively); REP2 cells after cryopreservation and thawing (Post REP F/T) and REP2 cells allowed to recover for 48 hours after cryopreservation and thawing (Post REP Rec.). F/T (frozen/thawed), gray bars represent non-cryopreserved cells. (b) Immuknow results from cryopreserved TILs from melanoma patients. TILs obtained from six melanoma patients were stimulated with PHA directly after thawing and after 48 hours of recovery. The boxes represent concentrations of intracellular ATP with median, minimum and maximum values (n = 5). Asterisks denote statistical significance where *p ≤ 0.05, **p ≤ 0.01.

Figure 3. Relative expression levels of (a) TGF-β, (b) Bcl-2, (c) p73, (d) IL-10, (e) FoxP3 and (f) FasL in PBMCs from healthy donors at different time points during the protocol. All values were normalized to the expression of β-actin and gene expression in fresh PBMC was set as one. F/T – frozen/thawed. Bars represent mean fold change (n = 5) + SD. Asterisks denote statistical significance where *p ≤ 0.05, **p ≤ 0.01.
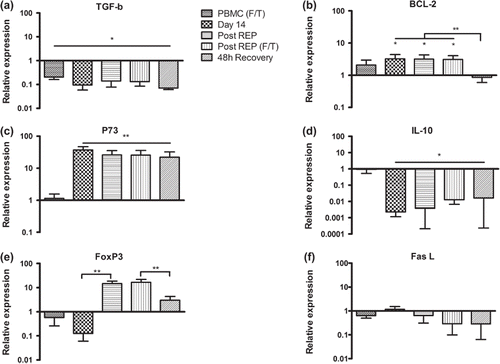
Figure 3. Relative expression levels of (a) TGF-β, (b) Bcl-2, (c) p73, (d) IL-10, (e) FoxP3 and (f) FasL in PBMCs from healthy donors at different time points during the protocol. All values were normalized to the expression of β-actin and gene expression in fresh PBMC was set as one. F/T – frozen/thawed. Bars represent mean fold change (n = 5) + SD. Asterisks denote statistical significance where *p ≤ 0.05, **p ≤ 0.01.

Figure 4. ELISpot assays showing the number of spot-forming cells in response to stimulation with CMV pp65 and unspecific peptide VMAT-1 in healthy CMV+ donors. Cells stimulated directly after isolation (a), immediately after freeze/thawing (b), after 14 days of culture in high dose IL-2 (c), after rapid expansion (d) and after 48 hours of recovery without IL-2 (e). Numbers of spot-forming cells per 1.5 × 10⁵ cells were measured. Bars represent mean of triplicate wells and SD. Asterisks denote statistical significance where *p ≤ 0.05, **p ≤ 0.01 and ***p ≤ 0.001. One of two representative experiments is shown.
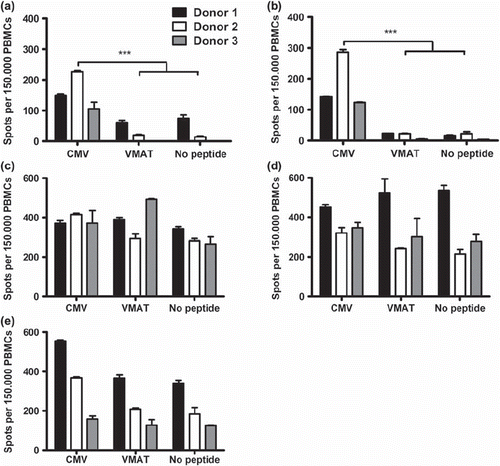
Figure 4. ELISpot assays showing the number of spot-forming cells in response to stimulation with CMV pp65 and unspecific peptide VMAT-1 in healthy CMV+ donors. Cells stimulated directly after isolation (a), immediately after freeze/thawing (b), after 14 days of culture in high dose IL-2 (c), after rapid expansion (d) and after 48 hours of recovery without IL-2 (e). Numbers of spot-forming cells per 1.5 × 10⁵ cells were measured. Bars represent mean of triplicate wells and SD. Asterisks denote statistical significance where *p ≤ 0.05, **p ≤ 0.01 and ***p ≤ 0.001. One of two representative experiments is shown.

Reprints and Corporate Permissions

Please note: Selecting permissions does not provide access to the full text of the article, please see our help page How do I view content?

To request a reprint or corporate permissions for this article, please click on the relevant link below:

Academic Permissions

Please note: Selecting permissions does not provide access to the full text of the article, please see our help page How do I view content?

Obtain permissions instantly via Rightslink by clicking on the button below:

If you are unable to obtain permissions via Rightslink, please complete and submit this Permissions form. For more information, please visit our Permissions help page.