4,519
Views
110
CrossRef citations to date
0
Altmetric
Original Articles

Health-related quality of life and disease specific symptoms in long-term thyroid cancer survivors: A study from the population-based PROFILES registry

, , , , , , , & show all
Pages 249-258 | Received 31 Jul 2012, Accepted 10 Oct 2012, Published online: 26 Nov 2012

Figures & data

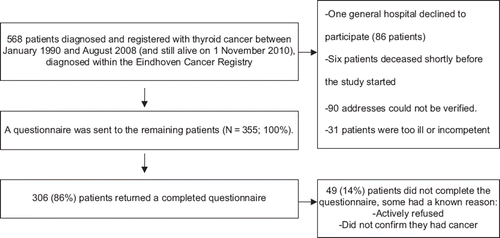
Figure 1. Flow-chart of the data collection process.

Figure 1. Flow-chart of the data collection process.

Table I. Socio-demographic and clinical characteristics of questionnaire respondents and normative population.

Figure 2. HRQoL of thyroid cancer survivors compared to normative population. (a) Mean EORTC-QLQ-C30 functioning subscale scores (0–100) of survivors in comparison with a Dutch normative population. A higher score means better functioning. An asterisk above the bar indicates a group difference (ANCOVA, p < 0.05, adjusted for comorbidity). (b) Mean EORTC-QLQ-C30 symptom subscale scores (0–100) of survivors in comparison with a Dutch normative population. A higher score indicates more symptoms. An asterisk above the bars indicates a group difference (ANCOVA, p < 0.05, adjusted for comorbidity).
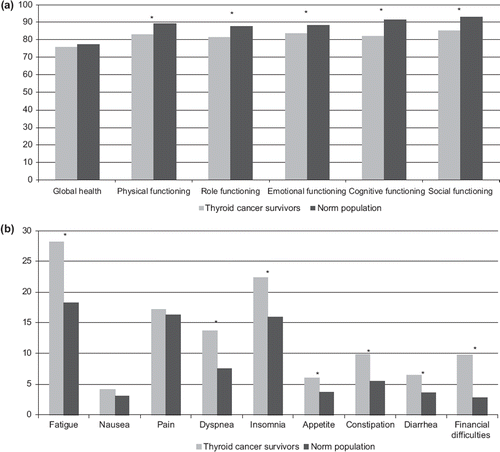
Figure 2. HRQoL of thyroid cancer survivors compared to normative population. (a) Mean EORTC-QLQ-C30 functioning subscale scores (0–100) of survivors in comparison with a Dutch normative population. A higher score means better functioning. An asterisk above the bar indicates a group difference (ANCOVA, p < 0.05, adjusted for comorbidity). (b) Mean EORTC-QLQ-C30 symptom subscale scores (0–100) of survivors in comparison with a Dutch normative population. A higher score indicates more symptoms. An asterisk above the bars indicates a group difference (ANCOVA, p < 0.05, adjusted for comorbidity).

Table II. Mean scores (±SD) of thyroid cancer survivors on EORTC QLQ-C30 and THYCA-QoL scales (0–100) and single items according to years since diagnosis.

Table III. Standardized betas of multiple linear regression analyses evaluating the association of independent variables with the HRQoL scales.

Table IV. Standardized betas of multiple linear regression analyses evaluating the association of independent variables with the thyroid cancer specific symptom scales.
Reprints and Corporate Permissions

Please note: Selecting permissions does not provide access to the full text of the article, please see our help page How do I view content?

To request a reprint or corporate permissions for this article, please click on the relevant link below:

Academic Permissions

Please note: Selecting permissions does not provide access to the full text of the article, please see our help page How do I view content?

Obtain permissions instantly via Rightslink by clicking on the button below:

If you are unable to obtain permissions via Rightslink, please complete and submit this Permissions form. For more information, please visit our Permissions help page.