Figures & data
Figure 1. Numbers of study participants during the study period. ITT, intention-to-treat.
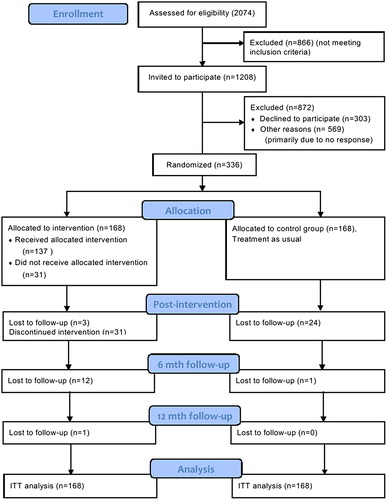
Table I. Baseline characteristics of participants in the randomized controlled trial.
Table II. Differences in sleep scale scores between MBSR and control group.
Table III. Differences in change scores between MBSR and control group at different times.
Figure 2. Change in sleep problem index II between baseline and post-intervention. Estimated quantile regression coefficients and 95% confidence intervals (grey areas) for changes in sleep problem index II between baseline and post-intervention. The table shows the estimated quantile regression coefficients for the 25th, 50th and 75th quantile. The values shown for the study group are for cases, as the controls were used as reference.
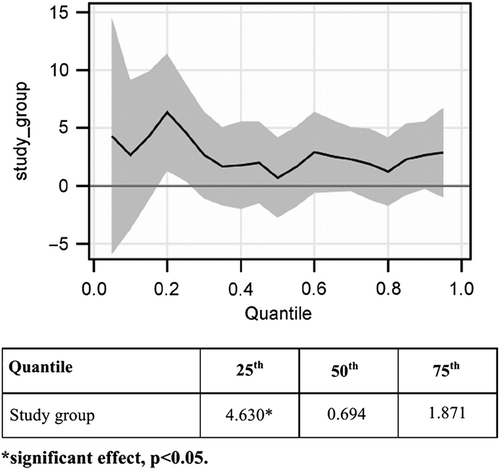
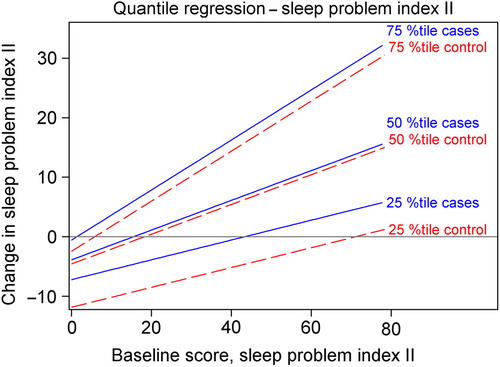
Figure 3. Quantile regression fit plot for change in sleep problem index II between baseline and post-intervention. The slopes of the lines are defined by the estimated quantile regression coefficient for baseline score. The estimated quantile regression coefficients of the study group determine the vertical difference between the lines representing cases and controls at a given percentile.