Figures & data
Table I. Baseline characteristics.
Figure 1. Proportions of 8 Gy × 1 treatments by calendar year during 1997–2007.
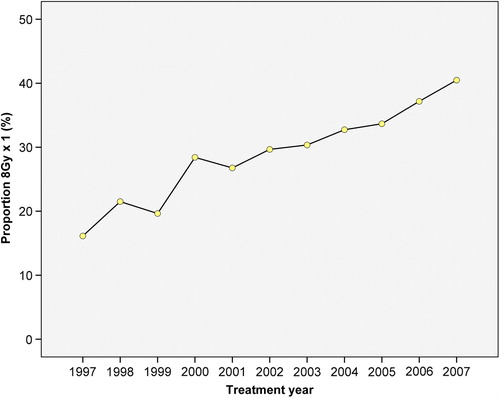
Table II. The distribution of single fraction treatment regarding sex, treatment centre, primary diagnose and region irradiateda crude relative risk of 8 Gy × 1 and relative risk of 8 Gy × 1 adjusted for other variablesb.
Table III. Proportion of treatment episodes of 8 Gy × 1 according to treatment centre and time interval.