Figures & data
Figure 1. XVI coordinate system where positive x and z coordinates correspond to left and anterior directions, respectively. The y coordinate corresponds to the cranial direction and points into the paper. CBCT scans were acquired with clockwise rotation with the gantry angle θ either from 2 90° to 90° or from 0° to 180°. r is the mean seed position and μ is the estimated location of the seed along the line connecting the focus point of the imaging system f and the location of the seed on the imager p. The figure is adapted from Poulsen et al. [Citation14].
![Figure 1. XVI coordinate system where positive x and z coordinates correspond to left and anterior directions, respectively. The y coordinate corresponds to the cranial direction and points into the paper. CBCT scans were acquired with clockwise rotation with the gantry angle θ either from 2 90° to 90° or from 0° to 180°. r is the mean seed position and μ is the estimated location of the seed along the line connecting the focus point of the imaging system f and the location of the seed on the imager p. The figure is adapted from Poulsen et al. [Citation14].](/cms/asset/5f6f77ba-f324-450b-978f-b49c76ae4c1e/ionc_a_747698_f0001_b.gif)
Figure 2. Panel (a) shows a typical result of the analysis of the motion of the prostate during a scan. The result of the analysis with the largest prostate motion observed is shown in panel (b). Also seen in the figure are four selected projection images from this scan. The stationary 3D positions of the seeds found in the reconstructed CBCT data are projected onto the images as circles, while the position of the seeds in the projection images as estimated by the image analysis algorithm are shown as crosses.
Figure 3. Distribution of standard deviations of the position of the prostate during pre- and post-treatment CBCT scans.
Table I. Prostate movement and tracking error.
Figure 4. Panel (a) show plots of the standard deviation of the position of the prostate σpre during the pre-treatment CBCT scan as function of the intra-fractional movement dintra. Also shown in the panel are values of the correlation coefficient R in each direction as well as the corresponding p-values. In panel (b) σpre is plotted against the standard deviation of the position of the prostate during the post-treatment CBCT scan, σpost. Unity slope is indicated by the dashed lines.
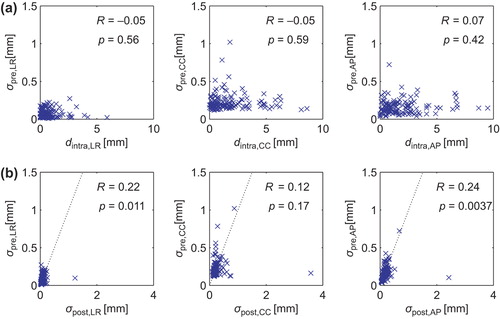
Figure 5. Median RMS error of the relative position of the seeds for all scans as function of gantry angle.