Figures & data
Table I. Number and mean age at diagnosis of colon and rectal cancer patients diagnosed during 2000–2007: country and stage at diagnosis (Dukes’ stage and SEER Summary Stage 2000).
Figure 1. Age-standardised excess hazard of death (per 1000 person-years, log scale) from colon cancer, by stage, country and time since diagnosis: Dukes’ stage (A: upper graphic) and SEER Summary Stage 2000 (B: lower graphic). 1. National data are used for Denmark and Norway. Other countries are represented by regional registries: Australia: New South Wales; Canada: Alberta and Manitoba; Sweden: Uppsala-Örebro and Stockholm-Gotland health regions; UK: England and Northern Ireland. In Canada and Denmark we analysed data for patients diagnosed in 2004–2007. 2. For each country, the size of the ‘bubble’ represents the proportion of cancers in each stage at diagnosis (see legend at bottom right of graphic). The relative size of the bubbles is therefore the same at each time since diagnosis.
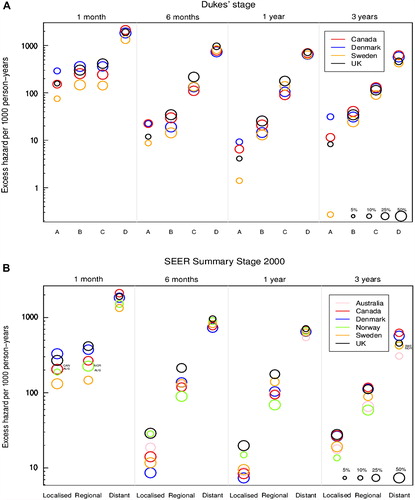
Table II. All-ages, age-specific and age-standardised one-year net survival (%) by stage at diagnosis and country for colon cancer patients diagnosed during 2000–2007.
Table III. All-ages, age-specific and age-standardised one-year net survival (%) by stage at diagnosis and country for rectal cancer patients diagnosed during 2000–2007.
Figure 2. Age-standardised excess hazard of death (per 1000 person-years, log scale) from rectal cancer, by stage, country and time since diagnosis: Dukes’ stage (A: upper graphic) and SEER Summary Stage 2000 (B: lower graphic) 1. National data are used for Denmark and Norway. Other countries are represented by regional registries: Australia: New South Wales; Canada: Alberta, British Columbia and Manitoba; Sweden: Uppsala-Örebro and Stockholm-Gotland health regions; UK: Northern Ireland and all cancer registries in England except the Thames Cancer Registry. In Canada and Denmark we analysed data for patients diagnosed in 2004–2007. 2. For each country, the size of the ‘bubble’ represents the proportion of cancers in each stage at diagnosis (see legend at bottom right of graphic). The relative size of the bubbles is therefore the same at each time since diagnosis.
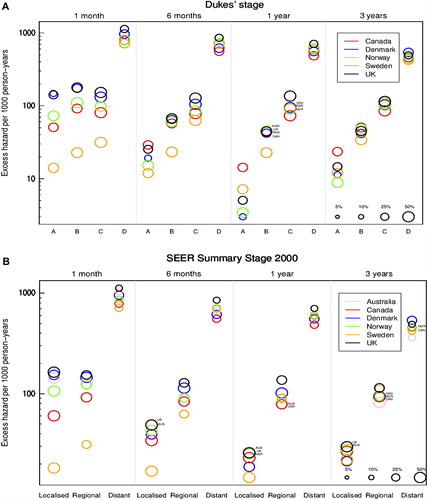
Figure 3. Colon cancer: age-standardised one-year net survival for patients diagnosed 2000–2007, by stage at diagnosis and country, Dukes’ stage (A: upper graphic) and SEER Summary Stage 2000 (B: lower graphic). X – survival estimate derived from those patients for whom the stage was recorded at diagnosis. I – range of survival estimates for all patients, both those with known stage and those for whom it was imputed, derived from 15 data sets after imputation (see text for details). 1. National data are used for Denmark and Norway. Other countries are represented by regional registries: Australia: New South Wales; Canada: Alberta and Manitoba; Sweden: Uppsala-Örebro and Stockholm-Gotland health regions; UK: England and Northern Ireland. In Canada and Denmark, data are for patients diagnosed in 2004–2007.
Figure 4. Rectal cancer: age-standardised one-year net survival for patients diagnosed 2000–2007, by stage at diagnosis and country, Dukes’ stage (A: upper graphic) and SEER Summary Stage 2000 (B: lower graphic). X – survival estimate derived from those patients for whom the stage was recorded at diagnosis. I – range of survival estimates for all patients, both those with known stage and those for whom it was imputed, derived from 15 data sets after imputation (see text for details) 1. National data are used for Denmark and Norway. Other countries are represented by regional registries: Australia: New South Wales; Canada: Alberta, British Columbia and Manitoba; Sweden: Uppsala-Örebro and Stockholm-Gotland health regions; UK: Northern Ireland and all cancer registries in England except the Thames Cancer Registry. In Canada and Denmark, data are for patients diagnosed in 2004–2007.