1,307
Views
12
CrossRef citations to date
0
Altmetric
Original Articles

Intermittent and continuous imatinib in a human GIST xenograft model carrying KIT exon 17 resistance mutation D816H

, , , , , , & show all
Pages 776-782 | Received 30 Nov 2012, Accepted 22 Jan 2013, Published online: 13 Mar 2013

Figures & data

Figure 1. The three-compartment model used for extracting pharmacokinetic information from dynamic 18F-FDG PET. CP is the concentration of 18F-FDG in plasma, and the tissue concentration CT is composed of non-metabolized, or free, 18F-FDG CF, and metabolized, or bound, 18F-FDG, CB. CT is further separated into not metabolised or free 18F-FDG, CF, and metabolised or bound 18F-FDG, CB. The kinetic parameters k1 (min−1) and k2 (min−1) describe the forward and backward 18F-FDG diffusion, respectively. The k3 (min−1) and k4 (min−1) parameters signify the rates of 18F-FDG phosphorylation and dephosphorylation, respectively, i.e., reflecting protein binding or glucose metabolism.

Figure 1. The three-compartment model used for extracting pharmacokinetic information from dynamic 18F-FDG PET. CP is the concentration of 18F-FDG in plasma, and the tissue concentration CT is composed of non-metabolized, or free, 18F-FDG CF, and metabolized, or bound, 18F-FDG, CB. CT is further separated into not metabolised or free 18F-FDG, CF, and metabolised or bound 18F-FDG, CB. The kinetic parameters k1 (min−1) and k2 (min−1) describe the forward and backward 18F-FDG diffusion, respectively. The k3 (min−1) and k4 (min−1) parameters signify the rates of 18F-FDG phosphorylation and dephosphorylation, respectively, i.e., reflecting protein binding or glucose metabolism.

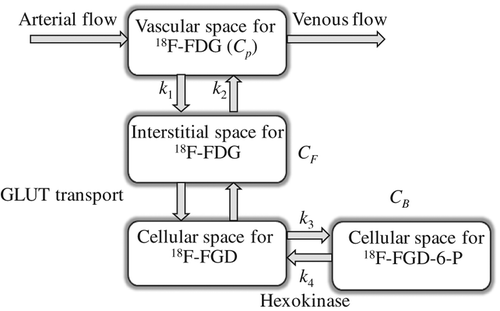
Table I. The primary antibodies used for immunohistochemistry.

Figure 2. Normalised tumour volume growth of the human GIST AHAX xenograft in mice receiving either imatinib (100 mg/kg/day) continuously, intermittently (one week on, one week off) or placebo (water). At the end of experiment, mice with particularly large tumours were scarified, causing a dip in tumour volume growth (the light grey symbols). The data are given as means and standard errors of the means.

Figure 2. Normalised tumour volume growth of the human GIST AHAX xenograft in mice receiving either imatinib (100 mg/kg/day) continuously, intermittently (one week on, one week off) or placebo (water). At the end of experiment, mice with particularly large tumours were scarified, causing a dip in tumour volume growth (the light grey symbols). The data are given as means and standard errors of the means.

Figure 3. An example of cumulative 18F-FDG uptake with time in a human GIST AHAX xenograft model (A). The white arrows point at the tumour. 18F-FDG uptake as a function of time for two selected voxels within the xenograft is shown in (B). The uptake curves for the free and bound 18F-FDG components obtained from kinetic modeling are provided.

Figure 3. An example of cumulative 18F-FDG uptake with time in a human GIST AHAX xenograft model (A). The white arrows point at the tumour. 18F-FDG uptake as a function of time for two selected voxels within the xenograft is shown in (B). The uptake curves for the free and bound 18F-FDG components obtained from kinetic modeling are provided.

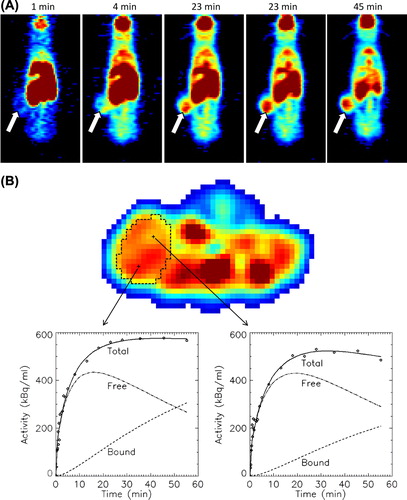
Table II. Results from pharmacokinetic modelling of dynamic 18F-FDG PET data. Data are given as median values.