Figures & data
Figure 1. Variations in CTV dose parameters with shifting the iso-center by 2 mm in different directions. In the upper panel the percentage of the CTV volume receiving dose of ≥ 95% of the prescribed dose is shown. The dose received by 98% of the CTV volume, and the dose percentage received by the hottest 2% of the CTV volumes are presented in the middle panel. In the lower panel the CTV generalized equivalent uniform dose for each simulated situation is shown.
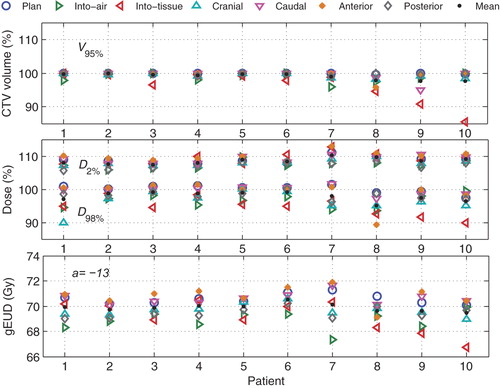
Figure 2. Variations in some CTV dose parameters with preceding treatment time shown at different time points 0 Gy, 22 Gy, 44 Gy, and 66 Gy for all patients.
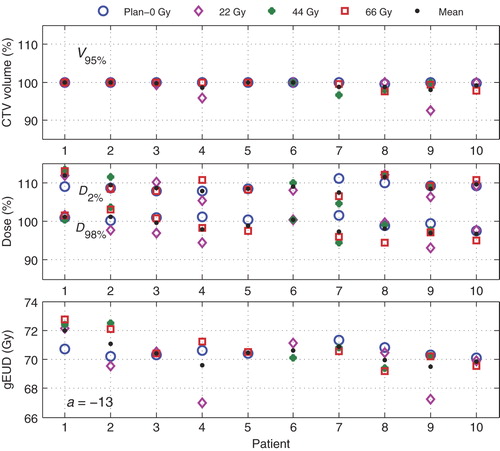
Figure 3. Variations in the mean dose (DMean), (gEUD) and (V40 Gy) received by the CL vocal cord with iso-centers shifts of 2 mm in the specified directions.
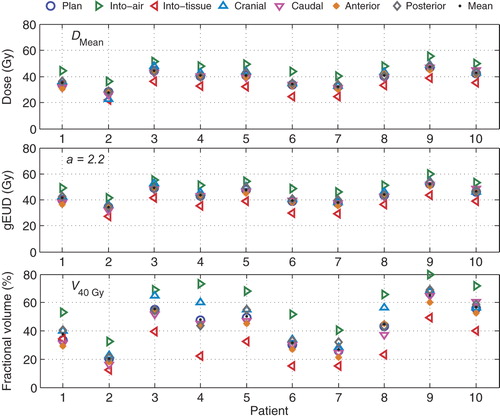
Figure 4. Variations in the mean dose (DMean), (gEUD) and (V40 Gy) received by the CL vocal cord with preceding treatment time shown at different time points 0 Gy, 22 Gy, 44 Gy, and 66 Gy for all patients.
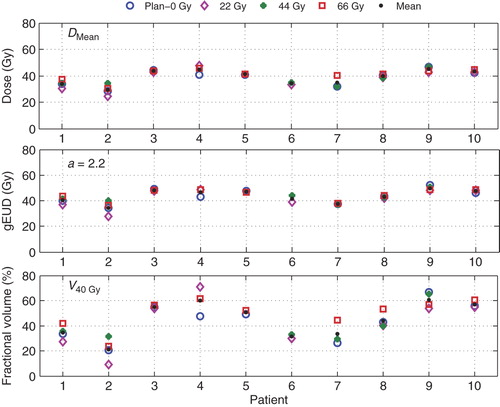
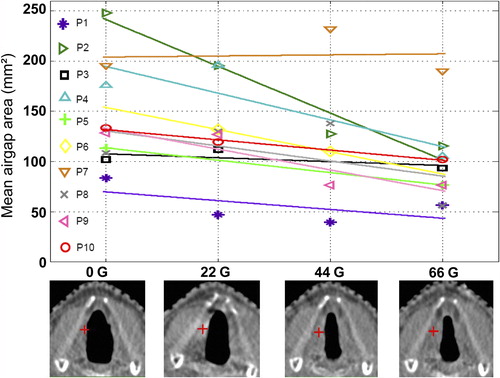
Figure 5. Upper panel: For each patient, the airgap area between the vocal cords, averaged over the various breathing phases (various axial CT-slices), as a function of delivered dose is presented. The lines are results of regression analyses, with on average, a statistically significant negative slope (see text). Lower panel: axial CT slices for patient 2 at the level of the iso-center (indicated by a red +) for doses 0 Gy, 22 Gy, 44 Gy, and 66 Gy.