Figures & data
Figure 1. (a) Steady state PO2 distribution for a 5.3 × 3.9 mm2 vessel map including two randomly placed 2 × 2 mm2 sub-regions (A, B). (b) Corresponding distribution of FMISO 4 h pi. Sub-regional averaging yields FH. Note the increasing retention with decreasing PO2 until it is diminished by necrosis. Vessels are white. (c) Averaged early FMISO signal. (d) Ratio between the distributions shown in (b) and (c) yields FH/P. The medianPO2 is substantially lower in sub-region A (9.4 × 10⁻³ mmHg) than in B (7.1 × 10⁻¹ mmHg). Inconsistently, FH is lower in A (15.0 kBq/ml) than in B (16.4 kBq/ml). FH/P is higher in A (1.05) than in B (1.00) and thus is consistent with medianPO2.
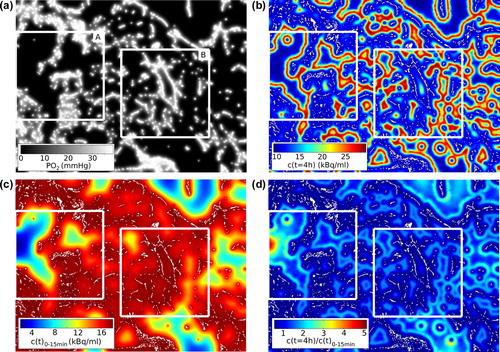
Figure 2. Scatter plots of medianPO2 against (a) FH and (b) FH/P. Red lines are fits restricted to hypoxic sub-regions (medianPO2 < 10 mmHg). Coefficients of determination R² for the restricted fits indicate a low correlation between medianPO2 and FH and a high correlation between medianPO2 and FH/P.
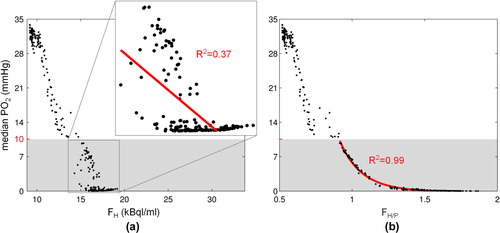
Figure 3. Receiver operating characteristic of FH/P (gray curves) and FH (black curves) for the identification of hypoxia. Solid lines refer to the identification of a medianPO2 < 2.5 mmHg in macroscopic sub-regions. Dashed lines refer to the identification of microPO2 < 2.5 mmHg in the 60 × 60 PO2 values underlying each FMISO parameter. Cut-off values applied to the FMISO parameters decrease along the curves from left to right. Optimum points are marked. The identification of critical medianPO2 is very sensitive and specific using FH/P (optimum YI = 1.0). Using FH is less effective (YI = 0.83). Both parameters are moderately accurate in identifying critical microPO2 values (YI = 0.63 and 0.60).