Figures & data
Figure 1. 18F-FMISO PET-CT scan of a cT4N0M0 oral cavity tumor 30 min after injection with diffuse uptake in tumor and normal tissues (A–C) and 3 hours after injection with specific tumor retention (D–F). Transversal (A + D), coronal (B + E) and sagittal (C + F) planes.
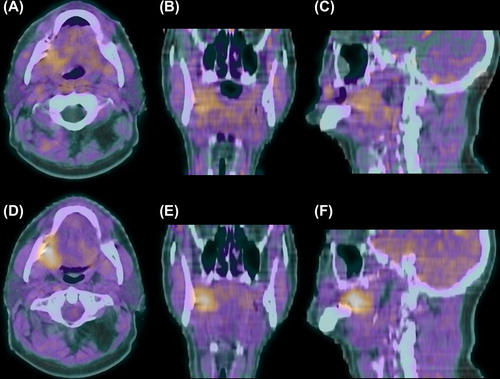
Figure 2. 18F-FLT PET-CT scans of a patient with a cT4N2M0 hypopharyngeal tumor before therapy (A), after induction cetuximab (B), after 1 week of radiotherapy (two doses of cetuximab, 10 Gy) (C) and after 3 weeks of radiotherapy (four doses of cetuximab, 32 Gy) (D). Note the concurrent reduction in cervical vertebra marrow proliferation after start of radiotherapy.
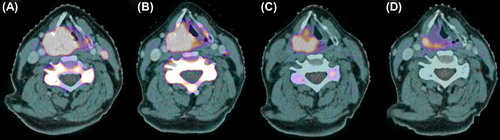
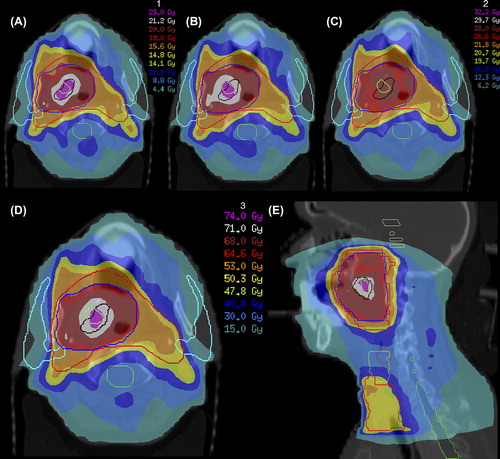
Figure 3. Dose-escalation to GTV80%1 (as delineated using a cut-off of 80% of maximum tumor uptake signal in a 18F-FLT PET-CT scan performed before start of radiotherapy) and GTV80%2 (as delineated in a 18F-FLT PET-CT scan performed after 1 week of radiotherapy) for a cT3N0M0 oropharyngeal tumor. Using IMRT with integrated simultaneous boost technique, total dose was 50.3 Gy to bilateral cervical lymph node regions (large planning target volume, red) and 68 Gy to primary tumor (small planning target volume, blue); in 34 fractions. GTV80%1 (black) and GTV80%2 (green) were consecutively irradiated with 2.3 Gy for 10 fractions, resulting in a dose of 71 Gy in total and a dose of 74 Gy in the overlapping region. (A and B) Dose distributions for first 2 weeks of treatment (A) and weeks 3 and 4 (B). (C) Dose distribution for remaining 14 fractions without dose-escalation. (D and E) Dose distributions of total treatment plan in transverse (D) and sagittal (E) planes. Parotid glands are delineated in sky blue and spinal cord in green. This figure was originally published in JNM. Troost EG, Bussink J, Hoffmann AL, Boerman OC, Oyen WJ, Kaanders JH. 18F-FLT PET/CT for early response monitoring and dose-escalation in oropharyngeal tumors. J Nucl Med 2010;51:866–74. © by the Society of Nuclear Medicine and Molecular Imaging, Inc.