Figures & data
Figure 1. Study design.
Figure 2. A) 3D clinical drawing of CGE for patient with large tumor in whole cervix with bilateral parametrial disease and vaginal infiltration along anterior and left wall reaching the lower third of vagina (FIGO stage IIIA) at diagnosis, Residual tumor after radiochemotherapy at time of BT was still in whole cervix with a central necrosis extending up to the right mid-parametrium and in the anterior-left upper third of vaginal wall. B) HR CTV delineation for the same patient on transverse CT section through the low cervix region with tandem applicator and interstitial needles: CT-based HR CTVstage, CT-based HRCTVstage + 3Dclin and MRI-based HR CTVMRI.
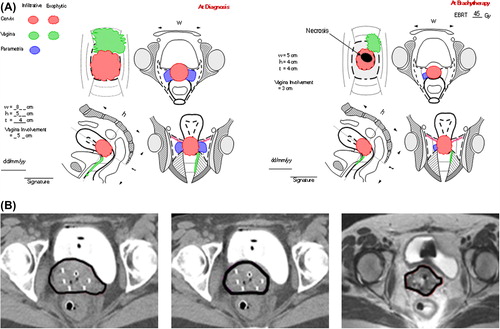
Figure 3. Significant decrease of the volume ratios (VR) of HR CTV by adding of CGE diagrams, for all standardized uterine lengths (1/1, 2/3, 1/2) used in the study. VRstage is the volume ratio of HR CTVstage/HR CTVMRI and VRstage + 3Dclin is the volume ratio of CT-based HR CTVstage + 3Dclin/HR CTVMRI.
Table I. Mean, standard deviations and ranges of volume, height, width, and thickness of HR CTVstage, HR CTVstage + 3Dclin and HR CTVMRI.
Figure 4. Significant decrease of the width ratio (WR) of HR CTV by adding of CGE diagrams. WRstage is the width ratio of CT-based HR CTVstage/HR CTVMRI and WRstage + 3Dclin is the width ratio of CT-based HR CTVstage + 3Dclin/HR CTVMRI.
Table II. Mean and standard deviations of the CT/MRI width ratios (WRx = Wx/WMRI) thickness ratios (TRx = Tx/TMRI) for all HR CTVstage and HR CTVstage + 3Dclin, and heights ratios (HRx = Hx/HMRI) for all standard uterine heights used for both CT-based contour types, grouped by different FIGO stages.