Figures & data
Figure 1. A dynamic 18F-FDG-PET image series in the coronal plane showing the heart and the implanted bilateral human breast cancer xenografts MAS98.12 xenografts. The corresponding uptake kinetics are shown in graphs A and B, respectively, where the latter constitutes the arterial input function (AIF). Also, the results from the pharmacokinetic model fit are shown.
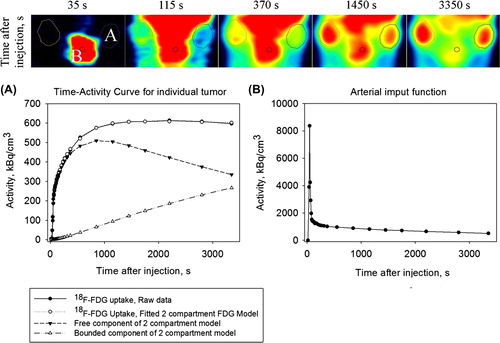
Figure 2. Cohort-based median time-activity curves, normalized to the AIF, for tumors at baseline and 24 and 72 hours after administration of bevacizumab.
Figure 3. Box plot of the pharmacokinetic parameters at different time points. Groups significantly differed from pre-treatment group marked with *(p < 0.05).
Figure 4. Tumor growth curves showing delayed tumor growth in the group with simultaneous administration of bevacizumab and doxorubicin compared to the group with a delayed administration of doxorubicin.