Figures & data
Figure 1. Example CBCT projection images of a brain (A, D), thorax (B, E) and pelvis (C, F) scan. Primary images (A–C) were calculated using the ray tracing algorithm, and have been log transformed. Scatter images (D–E) were calculated by MC simulations, and the images show air kerma calculated at the detector plane. Histograms (G–I) were calculated from both the primary and scatter signal, and normalised to unit area in the displayed air kerma range. For the brain scan, the primary photons in the air region surrounding the head gave rise to a signal in the histogram at higher air kerma values than shown in (G).
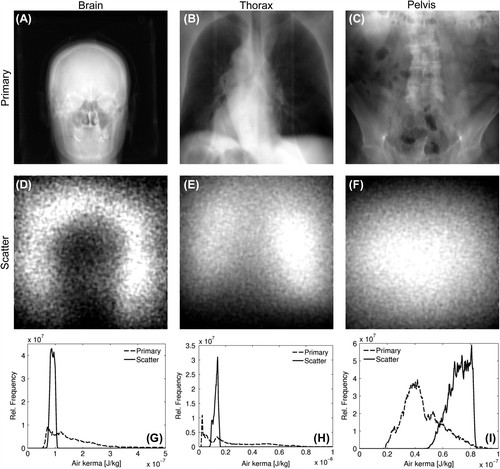
Table I. Scatter simulation time.
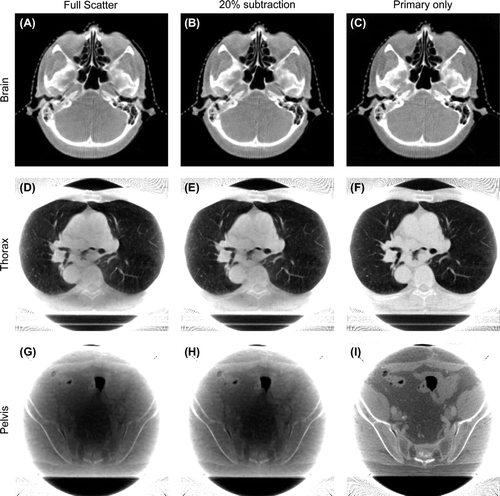
Figure 2. CBCT images reconstructed from the calculated brain (A–C), thorax (D–F) and pelvis (G–I) scans. Reconstructions are based on projection images calculated in steps of 1.25°, and reconstructed using an FDK type algorithm. For each scan, three images are reconstructed. The first reconstruction is based on the total signal from both primary and scattered photons (A, D, G). The second is based on a constant scatter subtraction of 20% in each projection image prior to reconstruction (B, E, H), and the third is based on the primary photons only (C, F, I). The displayed CBCT slices are examples, and not chosen centrally from the datasets.