Figures & data
Figure 1. Measurements of the uniform dose approach and the dose painting approach of the seven-field IMRT dose distribution together with the calculated dose distribution and gamma analysis between the measured and calculated distributions, viewed in the transverse plane, the coronal plane and the saggital plane. The dose distributions are shown with 10–90% isodose curves with 10% intervals.
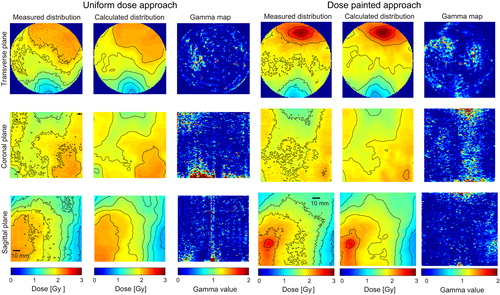
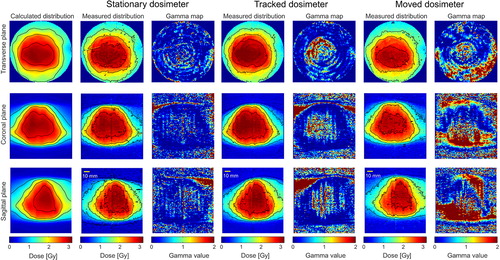
Figure 2. Calculated stationary dose distribution followed by measurements and calculated gamma map of the stationary dosimeter, the tracked dosimeter and the dosimeter with motion induced. The dose distributions are shown with 30%, 50%, 70% and 90% isodose curves.
Supplemental material