Figures & data
Figure 1. Representative example of the patient dataset for one of the patients with delineated structures from the planning phase. a) shows a planning CT slice with left (cyan) and right (magenta) lungs, the CTV (green) and the PTV (red), b) shows a kV x-ray with the planning structures projected, and c) shows an MV image with the PTV projected.
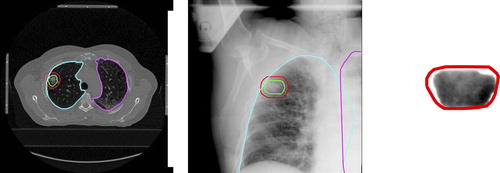
Figure 2. Description of the process of alignment of 2D images in time. a) depicts the image processing method to extract the diaphragm motion, with a dimmed region of interest, where the white dots result from edge detection and the green dots from a Hough transform for circles, b) shows a plot of the kV and the interpolated MV motion signals, c) shows a plot of the correlation between the two signals, and d) shows a plot of the time difference between each MV projection and its closest kV projection.
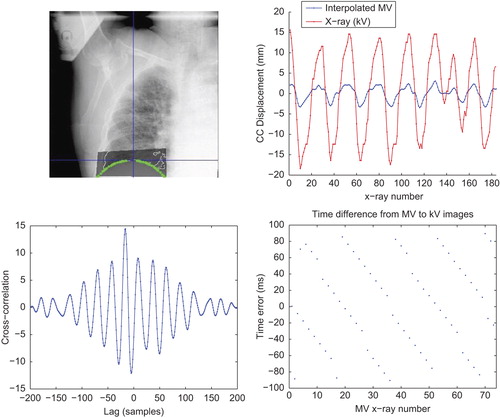
Figure 3. Plots of the extracted displacement along CC (green) and AP (red) directions comparing five (a) and six (b) DOF when using one projection image sequences. Both plots are compared with the diaphragm motion.
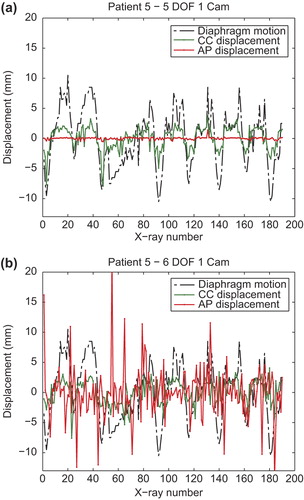
Table I. Summary of the results obtained for all the patients. The first three columns show the measured amplitude of the diaphragm motion extracted from the kV images and the measured amplitude of the tumor motion along CC and AP directions annotated from the MV images. The next two columns, describe qualitatively how well motion was extracted by registration in the CC and AP directions. Finally, the table shows the RMS error and the amplitude of the extracted AP motion when using one or two projection images.
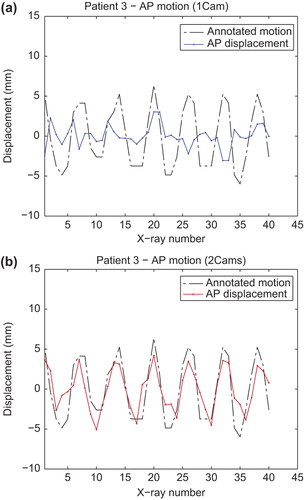
Figure 4. Plots of the extracted displacement along the AP direction in six DOF when using one (a) or two (b) projection image sequences. Both plots are compared with the annotated motion (dashed line).