Figures & data
Figure 1. Distribution of cases with pancreatic cancer in the Swedish Cancer Register (CR) and the Swedish Patient Register (PR).
Table I. Number (%) of patients with diagnosis of pancreatic cancer in the Swedish Cancer Register (CR) and the Swedish Patient Register (PR) between 1990 and 2009.
Figure 2. Distribution of cases with biliary tract cancer in the Swedish Cander Register (CR) and the Swedish Patient Register (PR).
Table II. Number (%) of patients with diagnosis of biliary tract cancer in the Swedish Cancer Register (CR) and the Swedish Patient Register (PR) between 1990 and 2009.
Table III. The concordance between the diagnosis of pancreatic cancer in the Swedish Cancer Register (CR) and the Swedish Patient Register (PR) and cause of death in the Causes of Death Register stratified by the number of hospital discharges.
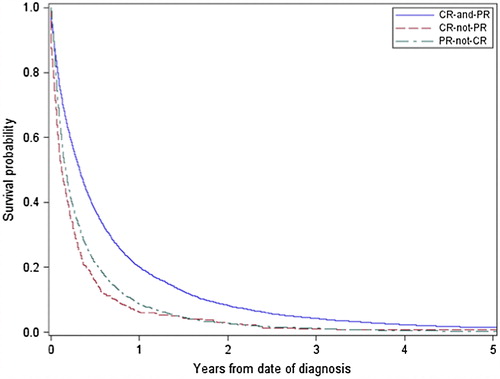
Figure 3. Survival probability of cases with pancreatic cancer registered in the Swedish Cancer Register (CR) and the Swedish Patient Register (PR).
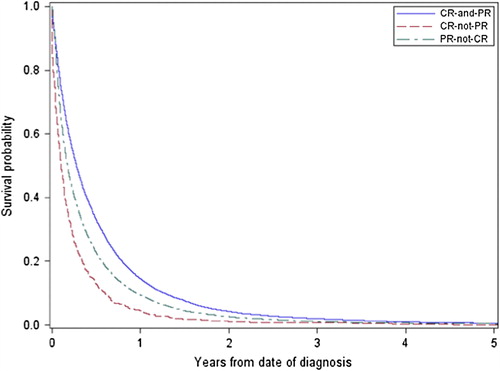
Table IV. The concordance between the diagnosis of biliary tract cancer in the Swedish Cancer Register (CR) and the Swedish Patient Register (PR) and cause of death in the Causes of Death Register stratified by the number of hospital discharges.
Figure 4. Survival probability of cases with biliary tract cancer registered in the Swedish Cancer Register (CR) and the Swedish Patient Register (PR).