
Figures & data
Table I. Demographic and clinical characteristics of 323 women with newly diagnosed breast cancer.
Figure 1. Mean severity of distress at breast cancer diagnosis and 4 and 8 months later according to the five groups identified in the TRAJ models for all women (n = 323).
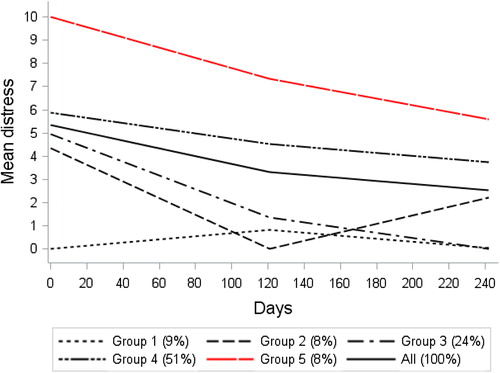
Figure 2. Mean severity of anxiety at breast cancer diagnosis and 4 and 8 months later according to the five groups identified in the TRAJ models for all women (n = 323).
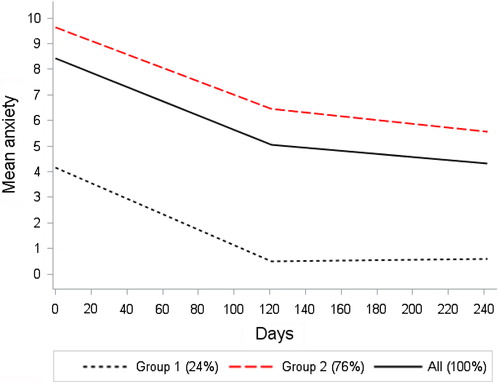
Figure 3. Mean severity of depression at breast cancer diagnosis and 4 and 8 months later according to the five groups identified in the TRAJ models for all women (n = 323).
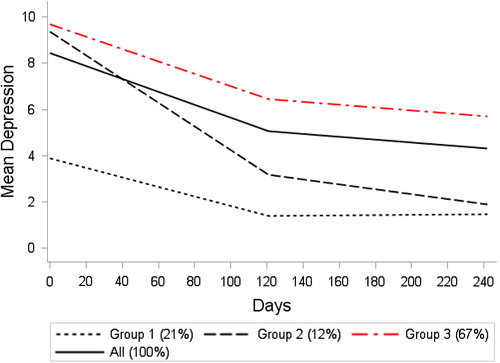
Table II. Model selection results for distress, anxiety, and depression for 323 women with newly diagnosed breast cancer.
Table III. Odds ratios (ORs) and 95% confidence intervals (CIs) for mutually adjusted associations between characteristics and trajectories of high distress (reference group 5), anxiety symptoms (reference group 2), and depressive symptoms (reference group 3), respectively (N = 323).