Figures & data
Table I. Patient demographics and treatment-related characteristics for 183 included breast cancer patients.
Figure 1. A. Schematic display of the four-field arrangement used in CT-RT. The red field borders depict the anterior-posterior field (1), the pink color indicated the oblique filed (2), and the blue color illustrates the location of the tangential fields (3 and 4). B. Delineated shoulder joint on the planning CT-images.
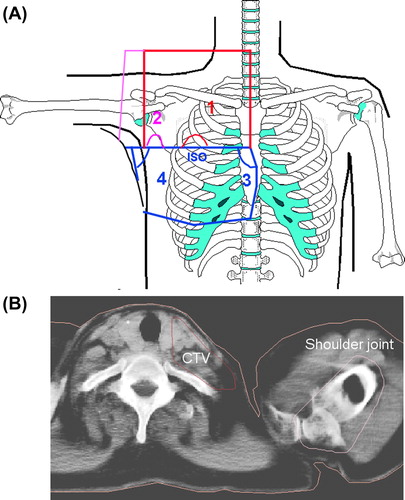
Table II. Arm/shoulder morbidity with different endpoints and morbidity degrees. The number of patients with a specific degree of morbidity for an endpoint is shown.
Figure 2. Correlation between dose and the shoulder volume (%) receiving 15 Gy or more (V15) with Use of arm as endpoint assessed by KAPS scores between 1 and 5 (1 = no symptom and 5 = severe symptom). Median values are indicated as horizontal bars.
Table III. Spearman's correlation between clinical endpoints and arm/shoulder dose. Statistically significant correlations are indicated with a cross.
Figure 3. Spearman's correlation between clinical endpoints and the shoulder volume receiving more than the specified dose, with 95% confidence interval indicated by vertical error bars. Only endpoints showing any significant correlations with dose are depicted. (*: significant correlation).