Figures & data
Table I. Patient characteristics (n = 66).
Figure 1. Flow chart over study participation during and after RT.
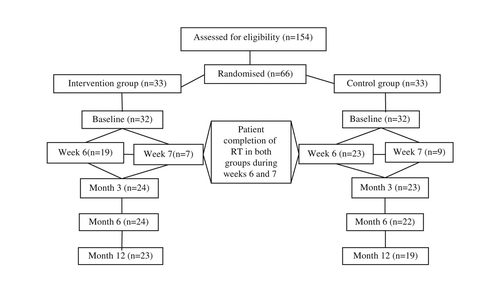
Table II. Frequency of training from study start until 6 and12 months after completed radiotherapy (RT) and percent mean change in maximum interincisal opening (MIO) from baseline to 12 months after completed RT (n = 66).
Figure 2. Mean change in MIO (%) from baseline, during RT and up to 12 months after completed RT. The lower number of patients weeks 6 and 7 is due to dose differences resulting in shorter time-period in external beam radiotherapy (see for details).
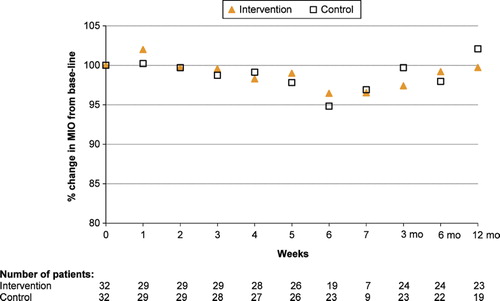
Figure 3. Mean change in MIO (%) from baseline, during RT and up to 12 months after completed RT. Patients with MIO decrease > 15%, who were offered training, is shown as a separate group. The lower number of patients weeks 6 and 7 is due to dose differences resulting in shorter time-period in external beam radiotherapy (see for details).
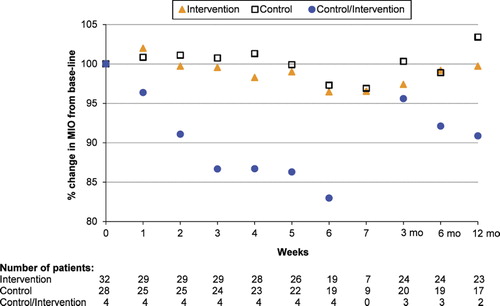
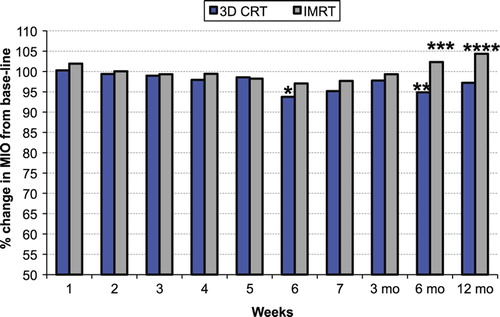
Figure 4. Mean change in MIO (%) from baseline, during RT and up to 12 months after completed RT in patients with 3D-CRT or IMRT. 3D conformal radiotherapy (3D-CRT) compared to baseline at 12 months:p = 0.22; *3D conformal radiotherapy (3D-CRT) compared to baseline at 6 weeks: p = 0.018; **3D conformal radiotherapy (3D-CRT) compared to baseline at 6 months: p = 0.040; ***3D conformal radiotherapy (3D-CRT) compared to IMRT at 6 months: p = 0.065; ****3D conformal radiotherapy (3D-CRT) compared to IMRT at 12 months: p = 0.084.