Figures & data
Table I. Summary of study characteristics.
Table II. Summary of mutation data and outcome measures.
Figure 1. The association between KRAS mutations in exons 3 and 4 with the a) ORR, b) PFS and c) OS in patients with KRAS exon 2 wild-type mCRC treated with anti-EGFR monoclonal antibodies. control, wild-type; events, response; experimental, mutant type; HR, hazard ratio; OR, odds ratio, seTE, standard error of HR; TE, Ln(HR).
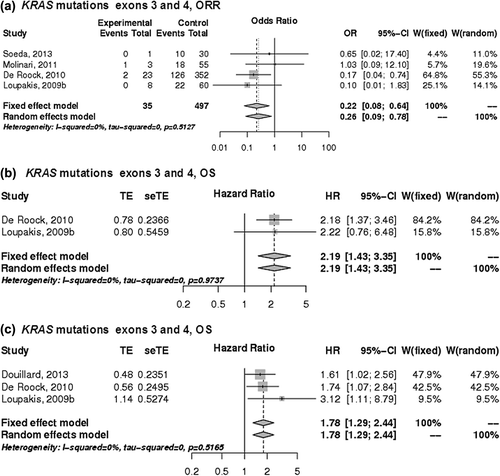
Figure 2. The association of NRAS mutations with the a) ORR, b) PFS and c) OS of patients with KRAS wild-type mCRC treated with anti-EGFR monoclonal antibodies. control, wild-type; events, response; experimental, mutant type; HR, hazard ratio; OR, odds ratio, seTE, standard error of HR; TE, Ln(HR).
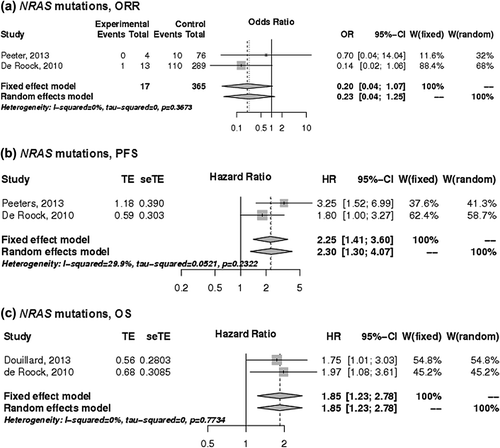
Figure 3. The associations of BRAF mutations with the a) ORR, b) PFS and c) OS of patients with KRAS wild-type mCRC treated with anti-EGFR monoclonal antibodies. control, wild-type; events, response; experimental, mutant type; HR, hazard ratio; OR, odds ratio, seTE, standard error of HR; TE, Ln(HR).
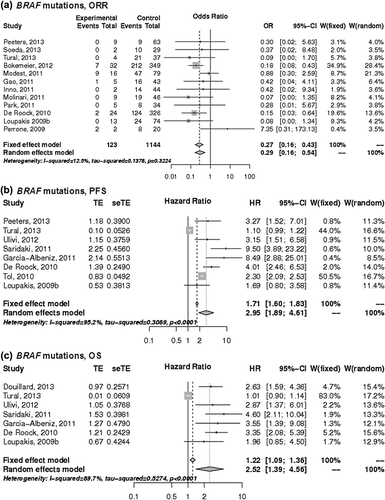
Figure 4. The associations of PIK3CA mutations with the a) ORR, b) PFS and c) OS of patients with KRAS wild-type mCRC treated with anti-EGFR monoclonal antibodies. control, wild-type; events, response; experimental, mutant type; HR, hazard ratio; OR, odds ratio, seTE, standard error of HR; TE, Ln(HR).
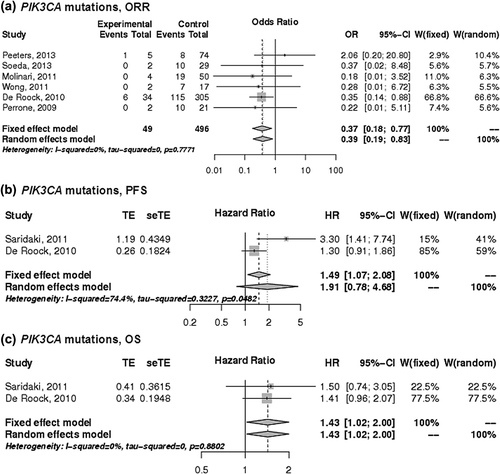
Figure 5. The associations of PTEN alterations with the a) ORR, b) PFS and c) OS of patients with KRAS wild-type mCRC treated with anti-EGFR monoclonal antibodies. control, wild-type; events, response; experimental, mutant type; HR, hazard ratio; OR, odds ratio, seTE, standard error of HR; TE, Ln(HR).
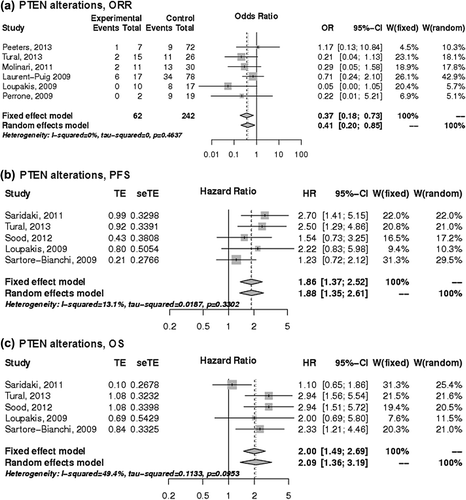
Table III. Response rates in metastatic colorectal cancer to anti-EGFR treatment.
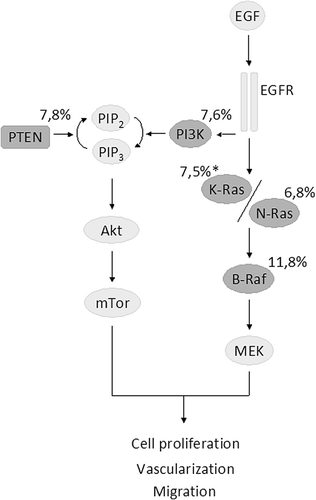
Figure 6. The EGFR-related pathways with genes of interest highlighted in gray. The mean mutation frequencies in KRAS exon 2 wild-type primary tumors from the 22 studies included are shown (*refers to mutations found in exons 3 and 4).