
Figures & data
Figure 1. Flow chart demonstrating the subgroups of patients chosen for analysis (study population in filled boxes). *Not included in this study.
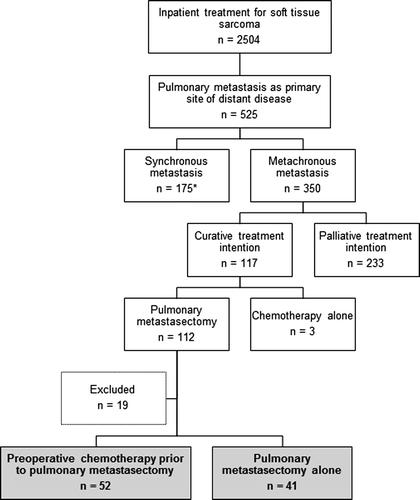
Table I. Comparison of clinicopathologic and treatment characteristics in study population.
Table II. Distribution of patients among histological and radiological response to preoperative chemotherapy.
Figure 2. Kaplan-Meier curves depicting (a) DSS and PFS for the two cohorts in study population; preoperative chemotherapy and surgery alone. (b) PFS comparing various histopathologic responses to chemotherapy assessed by Huvos grading system and (c) DSS and PFS for various radiological responses; partial response (PR), stable disease (SD) and progressive disease (PD).
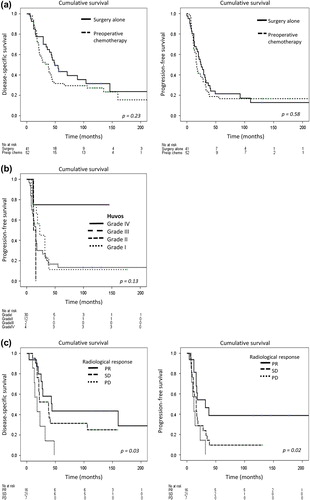
Table III. A. Uni- and multivariate analysis in histological response groups. Progression-free survival.