Figures & data
Figure 1. Stratification of study population with respect to breast cancer treatment at time point of cardiopulmonary exercise testing (CPET).
Table I. Characteristics of the study population.
Table II. Maximal (peak) and submaximal fitness parameters, mean (SD).
Figure 2. Distribution of VO2peak, presented as percentage of expected values for healthy women with the same age and BMI. The boxes present the 1st and 3rd quartiles, the middle line the medians, and the Whisker-ends the 5th and 95th percentiles.
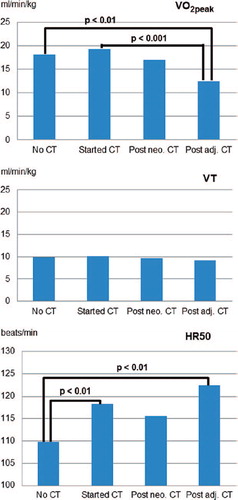
Figure 3. Adjusted mean values of each treatment category regarding VO2peak, VT, and HR50. Least square means were calculated using analyses of covariance models adjusted for age, BMI, smoking before diagnosis, walking, cycling, and sports before diagnosis, sports during adolescence, use of beta-blocker, and pre-existing heart diseases. Differences between categories were tested using Tukey-Kramer tests and all statistically significant differences (p < 0.05) are indicated in the figures.